

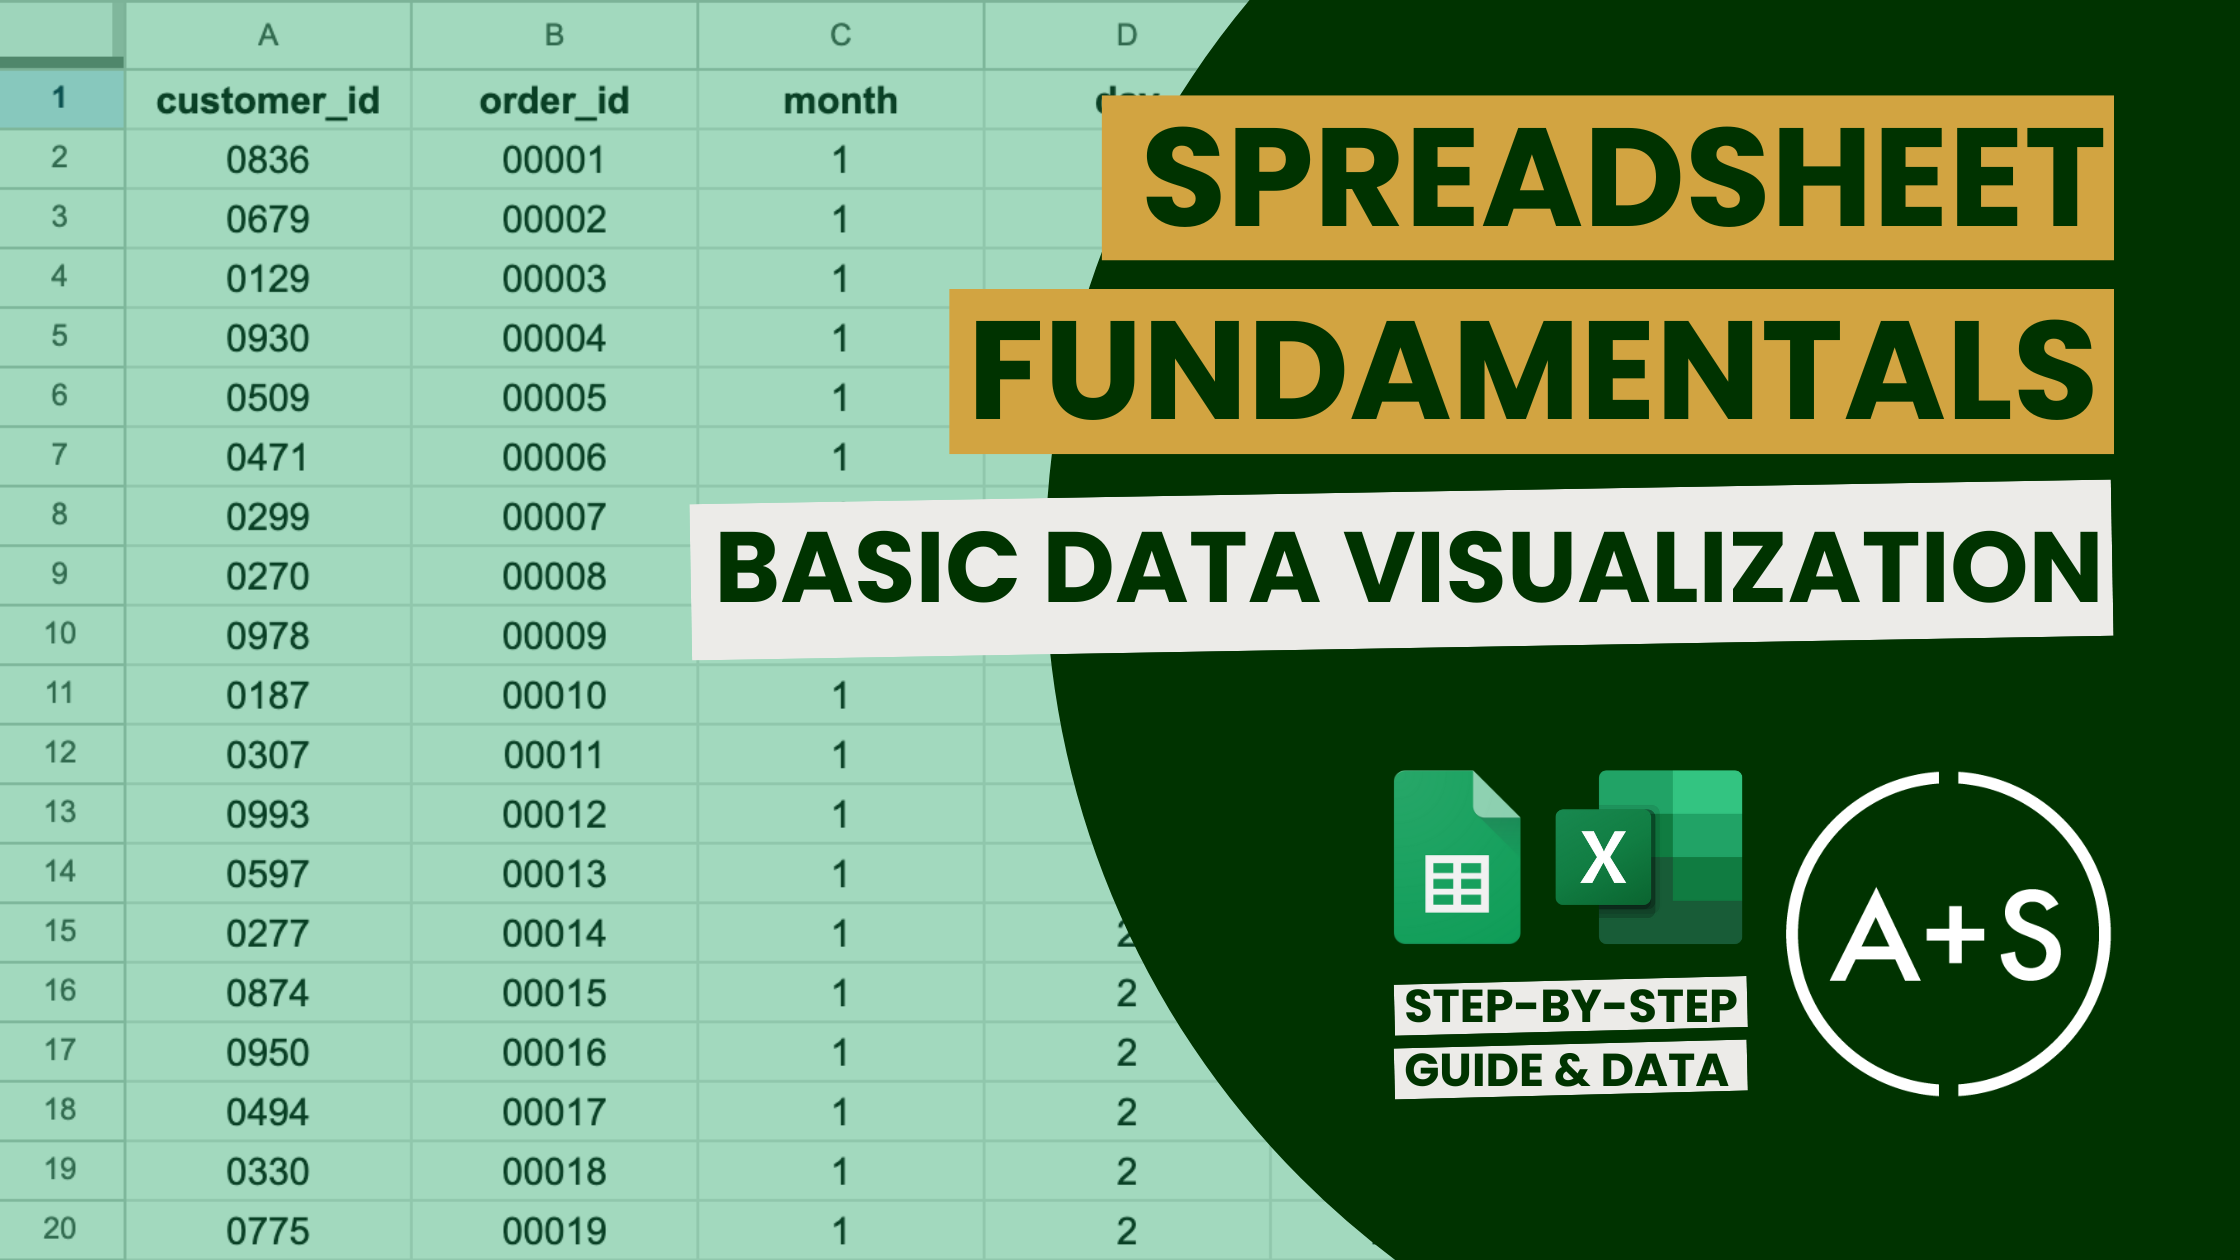
Today we wrap up our Spreadsheet Fundamentals series with a lesson on the essentials of data visualization. This guide will equip you with the skills to turn extensive numerical data into compelling visual narratives in spreadsheets, adding impact and clarity to your analyses.
How Spreadsheets Help Us Visualize Data
With their ability to reveal hidden patterns and insights within raw data, spreadsheets are powerful tools. They provide three main methods for effectively visualizing data:
- Basic Visualizations: Through the use of spreadsheets, we have access to a variety of visualization options including bar graphs, line graphs, pie charts, and scatter plots. These tools are essential in helping us recognize and comprehend important patterns within the data.
- Contrast Application: In spreadsheets, utilizing contrast is an incredibly effective tool for visual communication. It brings clarity, emphasizes important patterns, directs focus, and simplifies complicated data. This can be easily accomplished by using conditional formatting.
- Calculations and Transformations: Spreadsheets are highly effective in carrying out intricate computations and transforming data. They empower us to manipulate and assess data in diverse manners, facilitating thorough analysis and consolidation of information.
By skillfully utilizing spreadsheets, we have the power to transform raw data into captivating visual narratives that foster comprehension. The versatility of spreadsheets is crucial in this undertaking, as they allow for data to be presented in multiple forms and give us the ability to efficiently manipulate and merge information.
Basic Visualizations: Easy and Customizable Charts
Creating charts in spreadsheets is incredibly easy. With just a few clicks, you can turn your data into a visual representation. Here’s how to get started:
- Quick Chart Creation: Simply highlight your data table, go to “Insert > Chart” in Google Sheets or Excel, and let the spreadsheet software generate a chart automatically. This function will save you valuable time by offering a shortcut to visualize data without having to create charts from scratch.
While the charts that are automatically generated may be convenient, they often need to be adjusted before they are truly effective. Fortunately, this can easily be done within a spreadsheet.
Spreadsheets provide endless possibilities for customizing charts. You have the option to select from a variety of chart types, adjust axis scales, include trendlines, and more. This versatility enables you to create visuals that effectively communicate your data and convey the desired message.
With a little extra effort in customizing your charts, you can turn simple and unattractive visuals into sophisticated and informative depictions of data.
Conditional Formatting: Using Contrast for Clarity
By using conditional formatting, you can make your spreadsheet cells more visually appealing and easier to understand. Here are some tips on how to utilize this tool effectively:
- Highlight Key Data: Color scales are a useful tool for highlighting patterns and outliers. A gradient color scale, for example, can be applied to a column of sales data to quickly identify the months with the highest and lowest sales figures.
- Leverage Dynamic Rules: Create guidelines that alter cell style depending on their assigned values. For example, you could indicate all cells with a value below a specified threshold in red, values above another threshold in green, and values falling in between in yellow.
- Plot Data Bars and Icons: You can easily see data represented visually in cells by using data bars or icon sets. Data bars fill the cell according to its value, while icon sets use symbols such as arrows or flags to represent various data ranges.
Through the use of conditional formatting, you can transform your raw data into a visually appealing and easily understandable format. This is especially helpful for monitoring performance, as it allows you to quickly identify which metrics are meeting expectations and which ones need attention.
Pivot Tables: Summarize and Aggregate Data
Pivot tables are incredibly useful for organizing and interpreting vast amounts of data. With their help, you can easily convert raw information into valuable insights. Here’s a guide to maximizing the capabilities of pivot tables:
- Summary Views: Select any cell within your data range. In Google Sheets, navigate to the Insert tab and choose Pivot Table. In Excel, click “Data > Summarize with PivotTable”. Choose “New sheet” to open a new tab in your spreadsheet with a blank pivot table template.
- Drag-and-Drop Customization: By using the pivot table editor, you can easily manipulate data elements by dragging and dropping them into rows, columns, values, or filters. This provides a great deal of flexibility in organizing and analyzing your data in various ways. For instance, you could categorize ‘Salesperson’ in the rows section and ‘Total Sales’ in the values section to view a breakdown of each salesperson’s total sales.
- Dynamic Updates: Pivot tables are dynamic and will adjust accordingly as your data changes, ensuring that your summaries are up to date at all times.
Pivot tables provide the opportunity for complex calculations and in-depth data analysis. For example, you have the ability to:
- Group Data: Group dates by months or quarters to analyze trends over time.
- Calculate Differences: Add calculated fields to show the difference between sales in different periods.
- Filter Data: Use filters to focus on specific segments of your data, such as sales from a particular region or product category.
Becoming proficient in pivot tables will improve your skills in summarizing and understanding extensive data sets, allowing you to conduct analyses more effectively and gain deeper insights.
Sparklines: Miniature, In-Cell Charts
Sparklines are tiny charts that can be placed within a single cell, offering a brief summary of trends. Here are some tips for using them effectively:
- Create Sparklines: In Google Sheets, type =SPARKLINE(data_range) to generate a mini chart within a cell. In Excel, select Sparklines from the Insert tab, then choose your data range.
- Track Trends: Incorporate sparklines into your dashboards and reports to track changes over time, such as fluctuations in sales throughout the months. This is especially beneficial for dashboards with limited space but a need to display trends accurately.
- Make Visual Comparisons: Include sparklines next to important metrics to quickly provide visual context. For instance, a column could display monthly sales data while adjacent sparklines illustrate the sales trend over time.
Sparklines are perfect for executive dashboards and concise reports, where the goal is to showcase important metrics without overwhelming the audience with large charts. They offer a quick overview of trends, allowing you to easily determine if your data is on track or not.
Practical Applications
By utilizing these visualization techniques, you can greatly improve your ability to analyze data in practical situations. Here are a few illustrations:
- Revenue Analysis: Track sales trends and compare performance across different product categories using bar charts and line charts.
- Performance Monitoring: Use conditional formatting to quickly identify high and low performers in your datasets.
- Trend Identification: Spot long-term trends and seasonal variations with line charts and sparklines, providing valuable insights into your data.
- Data Summarization: Create pivot tables to summarize complex datasets, making it easier to present findings to stakeholders in a clear and concise manner.
By integrating these techniques into your work routine, you can enhance the precision and efficiency of your data analysis, resulting in more impactful business choices.
Step-by-Step Guide and Practice Dataset
For those looking to improve their skills, there is a step-by-step guide and practice dataset available [via this link]. These resources will give you the opportunity to sharpen your abilities and master the techniques discussed in this tutorial.


