


Today, we are looking at an extremely important source of primary data for the analyst: Surveys.
The rise of virtual platforms like Qualtrics, Alchemer, SurveyMonkey, and others has made online surveys a widely used tool in market research. These technologies offer more efficient and accurate data collection methods compared to traditional approaches, allowing researchers to gain valuable insights into consumer behaviors on a larger scale. As an analyst, these tools are crucial for obtaining vital information that informs decision-making processes.
While surveys are valuable instruments for gathering insights, the quality of your data depends heavily on how well the survey is constructed. Every aspect – from question creation to survey layout – plays a critical role. In this newsletter, we will discuss key strategies for improving your survey design and ensuring clearer and more reliable results.
Survey Structure: The Case For A Flow Chart
A successful survey requires careful planning and organization. Flow charts serve as a helpful visual tool to map out the logical structure and order of questions and responses. They act as a guide to ensure a methodical and productive survey that achieves its research objectives.
One key feature of using flow charts in survey design is the ability to create different paths based on how respondents answer certain questions. This allows for targeted surveys that can provide more relevant and insightful information for specific groups of individuals.
Moreover, screener questions are commonly used at the beginning of a survey to determine if the respondent meets the desired criteria for the study. This helps eliminate irrelevant data and conserve resources. For business owners, incorporating screener questions can also help reduce costs by only paying for completed responses that meet specific requirements.
Here’s an example of a well-designed flow chart:
Source: Malhotra, “Marketing Research: An Applied Orientation (Seventh Edition)”
Overall, familiarizing oneself with flow charts and incorporating them into survey design can greatly enhance the efficiency and effectiveness of market research studies.
Types Of Questions
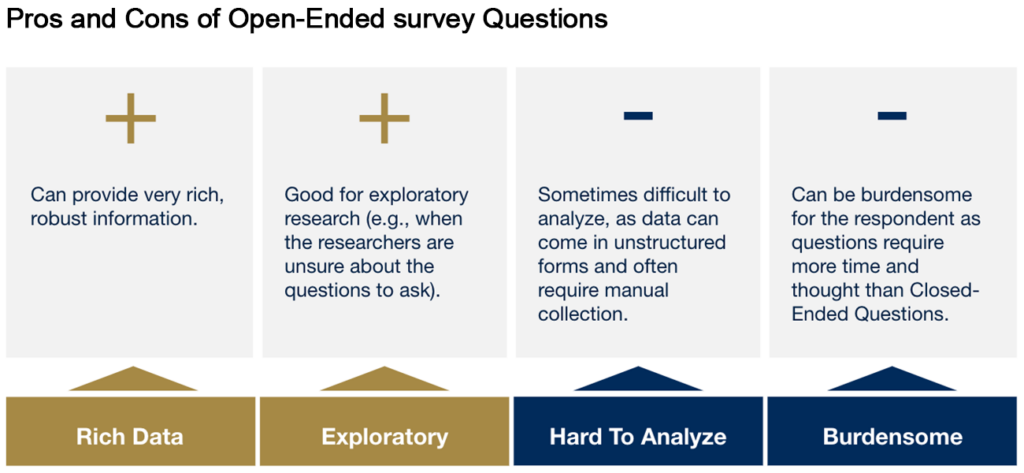
Surveys rely heavily on the questions asked, which can be divided into two main types: Open-ended and Closed-ended. When collecting data from participants or target market consumers, it is important to use a balance of both types of questions.
Open-ended questions offer unique opportunities for analysts, but also come with their own set of challenges. The biggest advantage is the potential for in-depth and diverse responses. However, this can also be a burden for the analyst, especially when dealing with a large group where dynamics may vary. It takes a lot of energy to manage the participants and ensure that all perspectives are represented.
One major challenge is the difficulty in analyzing free-form responses compared to closed-ended questions which can easily be turned into data. However, with advancements in AI and technology, this task is becoming less daunting. In contrast, closed-ended surveys provide immediate data analysis.
Source: Hartman
When seeking detailed and nuanced responses, open-ended questions are the way to go. They allow for a deeper exploration of thoughts and ideas, but they do require more time to process.
On the other hand, closed-ended questions are perfect for obtaining specific data that is easy to compare and analyze. These questions can be further classified into two types of scales: categorical, which group responses into distinct categories, and numerical, which assign numerical values to responses for easier analysis.
Categorical scales ask participants for a ranking of choices (referred to as “ordinal” questions), or present them with a series of predefined options (known as “nominal” questions). The most widely used method in data collection is a nominal question — the interval scale — where individuals are asked to rate something on a scale ranging from one to five. This allows for precise measurement and comparison of responses.
Open-ended questions allow for more freedom and open-ended responses, while closed-ended questions aim for specific answers and direction. Ultimately, a combination of both types of questions will result in a well-rounded understanding of the topic at hand. By understanding the different types of questions and when to use them, researchers can gather the most valuable data for their studies.
6 Common Errors To Avoid
When creating a survey, it is crucial to ensure that the questions are appropriate and worded correctly. The questions should be clear, unbiased, and easy for the respondent to answer. It takes a lot of effort to design a survey properly and eliminate any bias, but it begins with understanding the common pitfalls in survey design.
There are six pitfalls that most frequently disrupt surveys and lead to biased responses. These include ambiguity, double-barreled questions, leading loaded questions, assumptions, burdensome questions, and sensitive questions. Let’s explore some examples of these pitfalls now:
- Avoid Ambiguity
- Ambiguity arises when survey questions are unclear, leading to varied interpretations.
- Example: The question “How often do you use social media apps?” is ambiguous because “often” can mean different things to different people.
- Solution: Use specific, simple language with clear options like “daily,” “weekly,” or “monthly” to ensure precise answers.
- Eliminate Double-Barreled Questions
- Double-barreled questions combine multiple ideas into one, making it hard for respondents to provide accurate answers.
- Example: Asking “Do you find our website attractive and easy to navigate?” addresses two separate issues in one question.
- Solution: Break down such questions into smaller, more focused ones, and avoid using “and” to prevent confusion.
- Avoid Leading/Loaded Questions
- Leading or loaded questions can bias respondents toward a specific answer, skewing survey results.
- Example: “Do you believe that patriotic Americans should purchase imported cars even if it means putting American workers out of a job?” is both leading and loaded.
- Solution: Reframe the question in a neutral way, such as “Do you think Americans should buy imported automobiles? Yes, No.”
- Avoid Assumptions
- Assumptive questions can bias responses by lacking necessary context or presupposing knowledge.
- Example: “Are you in favor of a balanced budget?” assumes the respondent understands the implications of a balanced budget.
- Solution: Provide context, like “Are you in favor of a balanced budget if it means an increase in personal income tax?” to ensure a more accurate response.
- Reduce Burdensome Questions
- Burdensome questions are difficult because they are complex or require recalling specific details.
- Example: Asking “How many times have you eaten dinner away from home in the last six months?” expects an exact number, which can be tough to recall.
- Solution: Simplify questions or offer multiple-choice or scale-based options to make answering easier.
- Handle Sensitive Topics Carefully
- Sensitive questions should be phrased with care to avoid discomfort and encourage honest answers.
- Example: Questions like “Thinking about last Friday, how many alcoholic beverages did you consume? 1 glass, 2-3 glasses, 4-6 glasses, more than 6 glasses” may leave respondents uncomfortable with responding truthfully.
- Solution: Use neutral language while framing questions related to sensitive issues and allow respondents to skip the question if they prefer, ensuring accuracy without causing discomfort.
By thoughtfully designing your survey with clear, unbiased, and considerate questions, you can enhance the quality and reliability of the responses you receive. This not only ensures that your data is accurate but also fosters a more positive experience for respondents, leading to more meaningful and actionable insights.
Additional Survey Considerations
Thoughtful survey design can significantly impact the quality of your data, ensuring accuracy, reducing bias, and encouraging higher completion rates. Here are a few key considerations to keep in mind as you create your survey.
- Surveys should start with easy to answer questions to build rapport with the respondent and to indicate that the survey is not burdensome.
- Tough and important questions should be placed in the middle of the survey. The respondent has committed to completing the survey and is expected to answer questions accurately.
- Sensitive and/or demographic questions, in turn, should be asked at the end of the survey to avoid making the respondent feel uneasy earlier on.
- Surveys should be designed to appear as short as possible. One common practice is to use multiple-grid layout where similar questions and responses are arranged in a grid format.
Conclusion
An effective survey is essential for gathering accurate data. To achieve this, it is important to prioritize clarity, eliminate bias, and create a seamless experience for respondents. By applying these principles, you can elevate your survey design and collect data with precision. And remember: Good Data = Good Analysis!


