

Understanding what truly matters to your customers is crucial for any brand. One of the most effective tools you can use to gain that understanding is the Importance-Performance Map (I-P Map). These powerful tools allow you to visually represent how consumers perceive your brand or product in comparison to competitors based on specific attributes. Today, we’ll explore the elegance of I-P Maps and how they can be used to pinpoint areas where your brand excels and identify opportunities for improvement.
What Are Importance-Performance Maps?
An I-P Map is a visual framework, fueled by consumer data, that represents how consumers perceive the importance of various attributes of a product or service and how your brand (and any other brand included in the survey) performs on those attributes. The map allows you to assess which attributes are most critical to your customers and how well your brand performs in these areas compared to competitors.
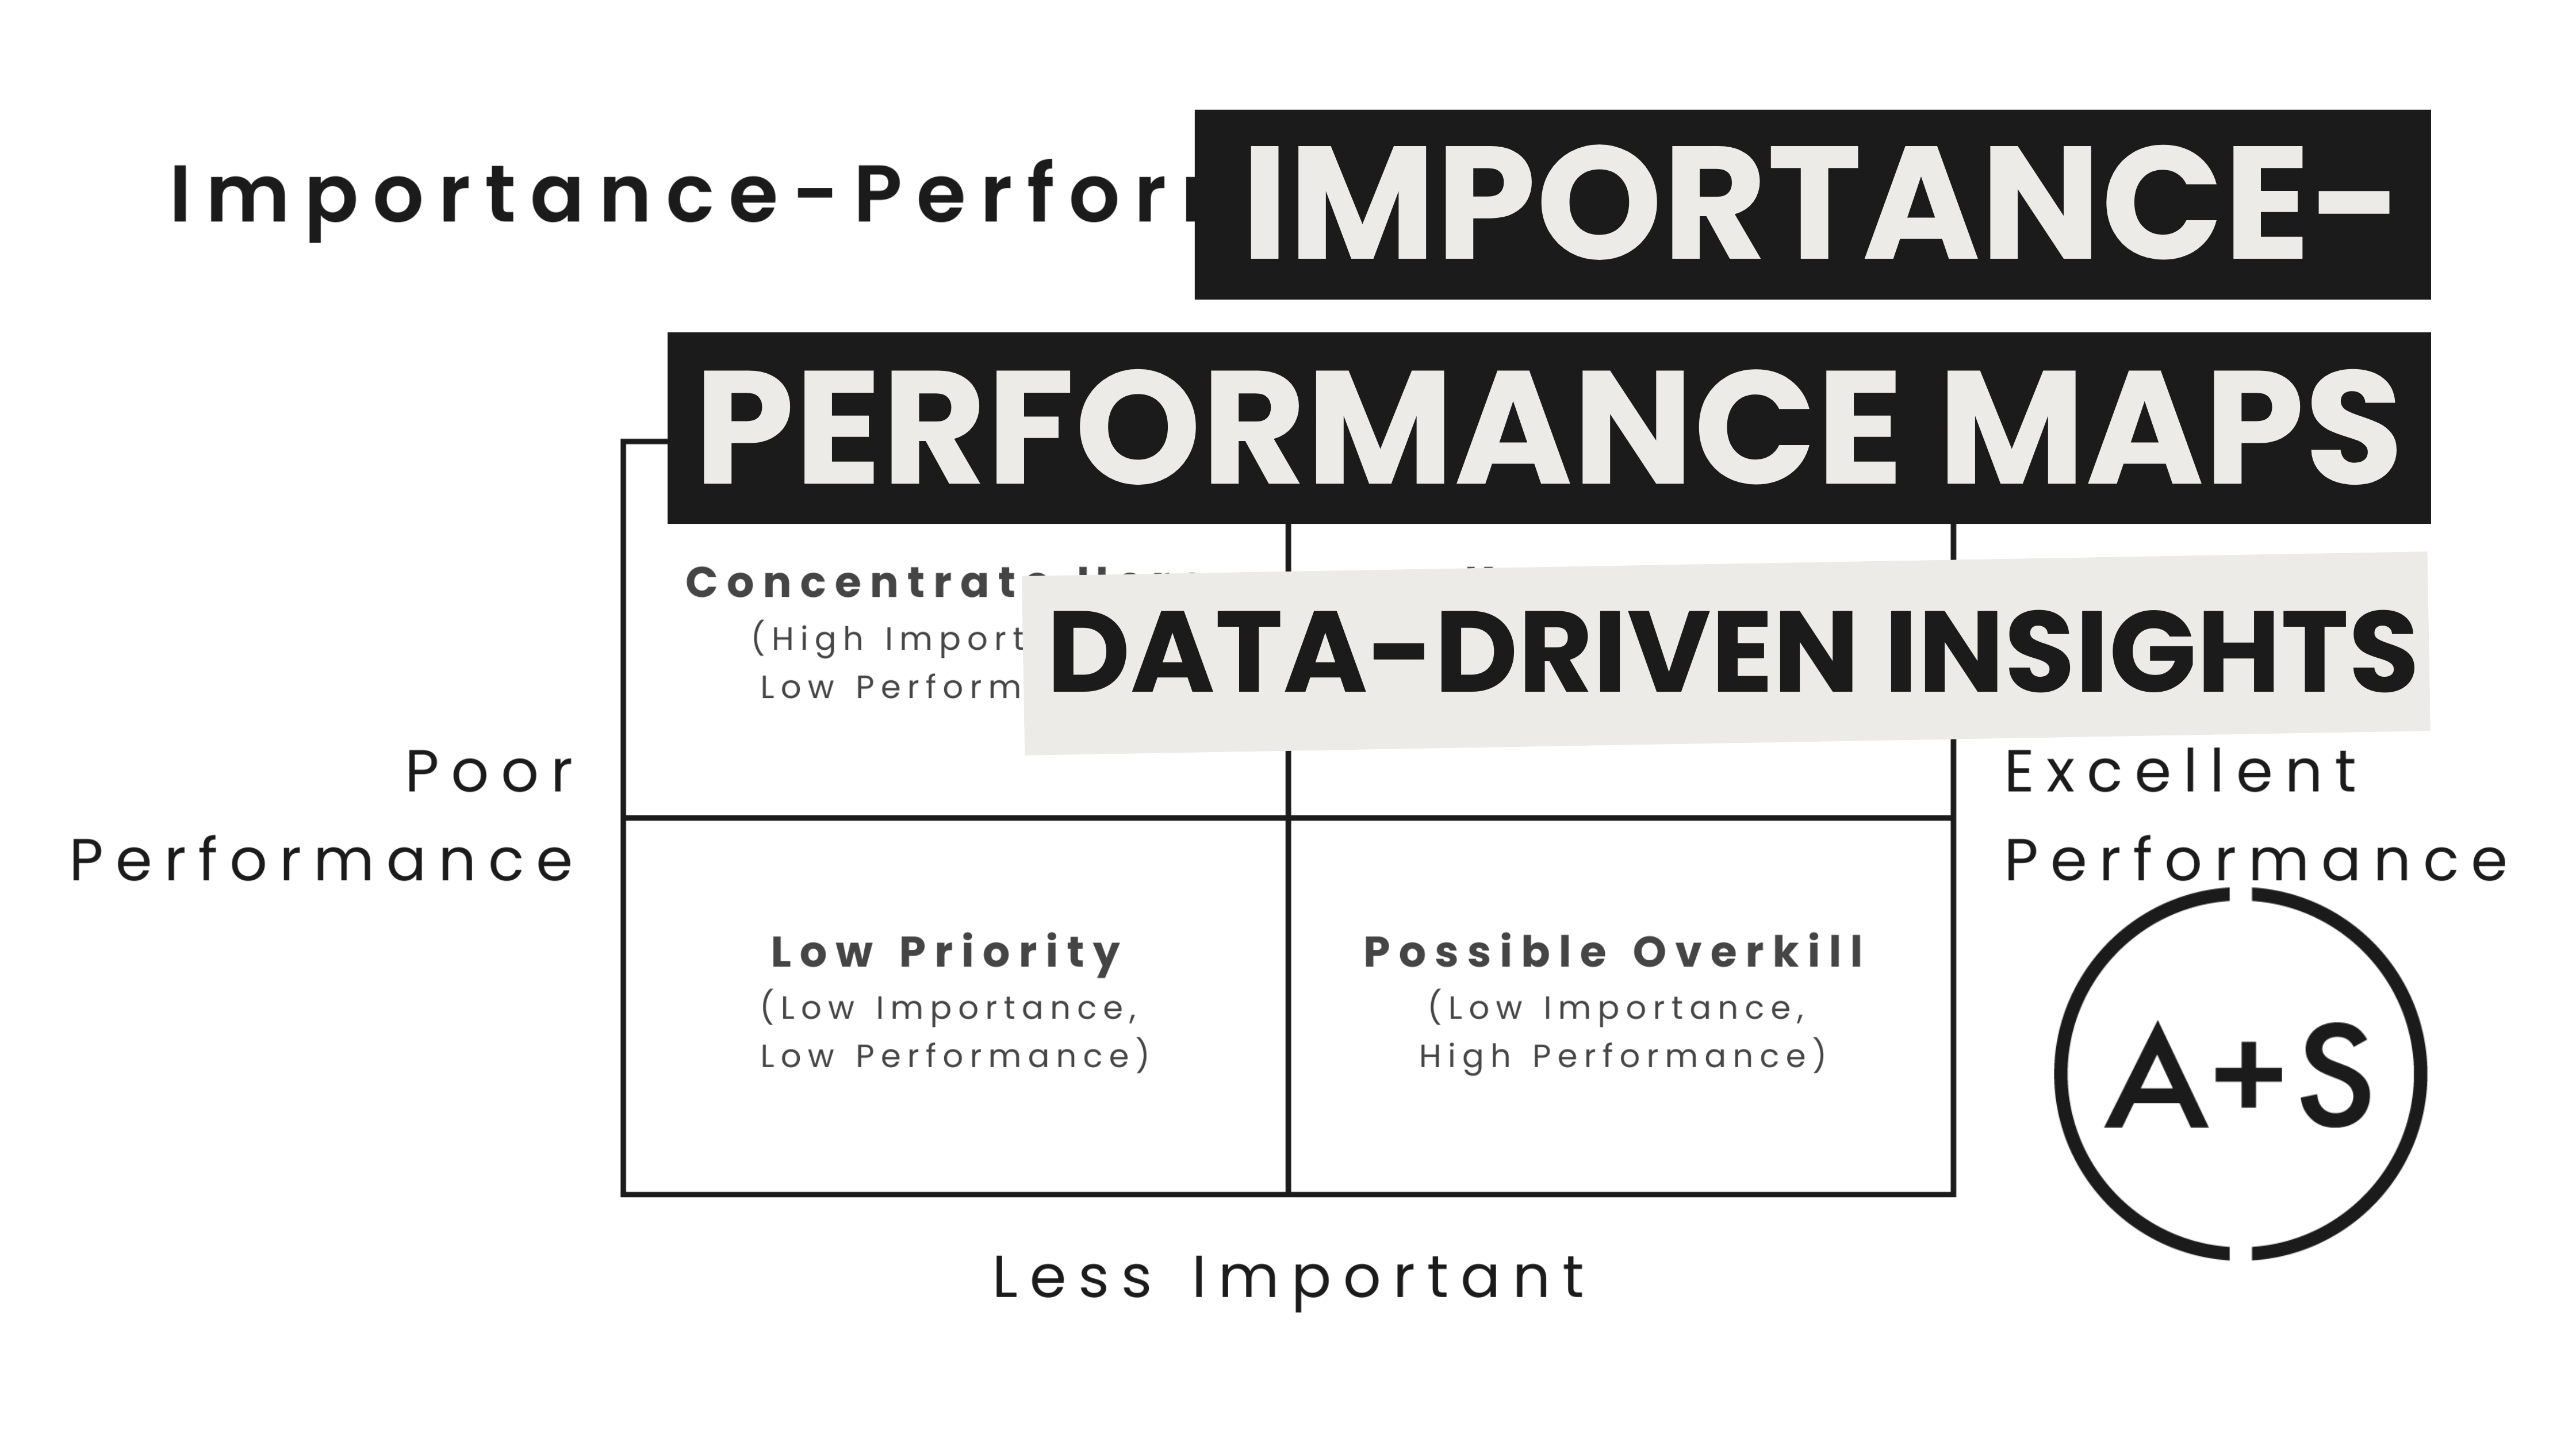
At its core, an Importance-Performance Map is a simple yet elegant two-by-two grid that provides a comprehensive understanding of consumer perceptions. The vertical axis represents the importance of various attributes, while the horizontal axis reflects your brand’s performance in these areas compared to competitors:
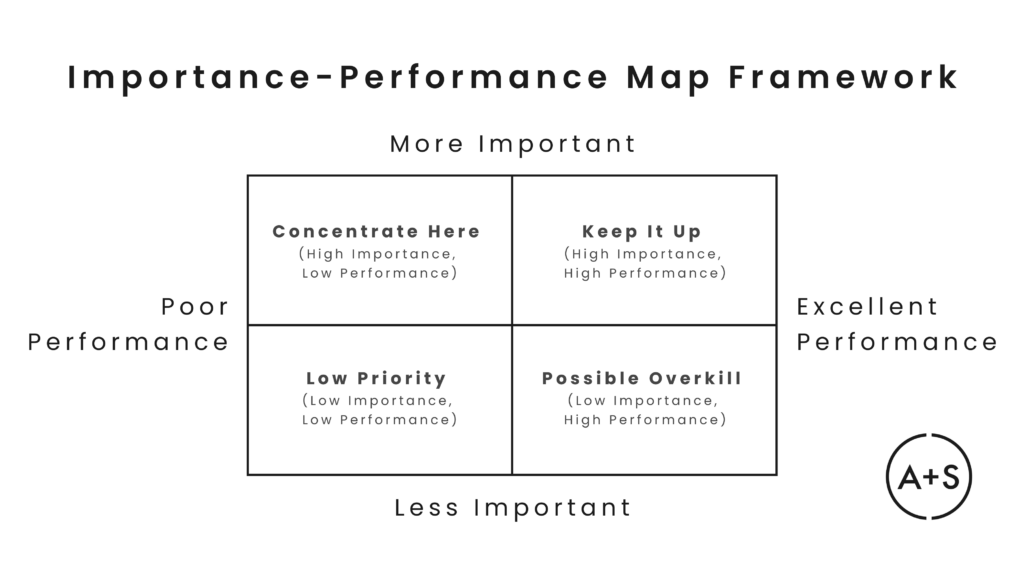
By mapping out where your brand stands, you can focus on excelling in areas that your customers prioritize, by creating a four quadrant map, each offering unique insights:
- Keep It Up: Attributes that are both highly important and where your brand performs well. These are your key strengths and should be maintained.
- Concentrate Here: Attributes that are very important to your customers but where your brand is underperforming. These are critical areas for improvement.
- Low Priority: Attributes that are less important and where your brand’s performance is also low. These are areas that may not require immediate attention.
- Possible Overkill: Attributes where your brand performs well but are not as important to your customers. Resources allocated here may be better used elsewhere.
By analyzing consumers’ placement of attributes within these quadrants, businesses can prioritize investments and make strategic decisions that align with what truly matters to their customers. In addition, when competitors are mapped, the framework helps identify keep areas of competitive advantage for your brand (and for your competitors!). Whether you’re assessing customer service, product quality, or other key factors, I-P Maps provide a clear and actionable visualization of your brand’s strengths and weaknesses.
This approach is versatile and can be applied across any industry where there is potential buyer evaluating a brand — from hotel amenities to healthcare services to customer satisfaction in retail. Understanding the insights derived from an I-P Map can help you focus on the areas that will most effectively enhance customer perception of your brand and drive business success.
What Data is Required?
Creating an insightful I-P Map hinges on gathering the right data. The map’s value comes from its ability to reveal not just where your brand stands, but where it stands in the eyes of your customers — and what truly matters to them. Here’s the data you need to make this happen:
- Importance Ratings:
- This data captures the voice of your customers by reflecting what they care about most when interacting with your product, service, or brand. For instance, in the hospitality industry, attributes like cleanliness, price, location, and amenities might top the list. In retail, it could be product quality, customer service, and pricing.
- Understanding the importance of these attributes is crucial because it tells you what drives customer decisions. Are they more concerned with getting the best deal, or do they prioritize exceptional customer service? Knowing what your customers value helps you focus your efforts on the areas that will most impact their satisfaction and loyalty.
- Performance Ratings:
- Just as important as knowing what matters to your customers is understanding how they perceive your brand’s performance on those attributes. Performance ratings provide this insight. They tell you whether customers feel that your brand meets, exceeds, or falls short of their expectations in critical areas.
- These ratings help you identify strengths to leverage and weaknesses to address. For example, if cleanliness is highly important to hotel guests but they rate your hotel’s cleanliness poorly, this is a clear area for improvement. Conversely, if your hotel is rated highly for its location but location is less important to guests, you might consider reallocating resources to areas that matter more.
Together, these two types of data — importance and performance — create a comprehensive picture of where your brand stands in the marketplace. The resulting I-P Map framework allows you to visually plot these attributes on a grid, highlighting areas where your brand is excelling and where it needs to improve to better align with customer priorities.
Where Does the Data Come From?
The quality and relevance of your data directly determine the insights you can draw and the strategic decisions you can make from the I-P Map. Here are the key sources of those data:
- Customer Surveys:
- Likert Scales: Surveys using Likert scales are the most common and effective ways to gather importance and performance data. Customers are asked to rate various attributes on a scale, typically 1 to 5 or 1 to 7. These ratings reflect both how important they find each attribute and how well they believe your brand is performing in those areas. Consumers give a rating using the scale for each attribute and then a rating for each brand (yours and your competitors) along each of those attributes.
- Forced Ranking: In some surveys, instead of rating attributes, customers are asked to rank attributes and competitors in order of importance. This approach forces respondents to make clear distinctions about what matters most, offering deep insights into their true priorities. By removing the possibility of ties, forced ranking provides a more precise understanding of the relative importance of different attributes. Consumers are asked to first rank each attribute in terms of importance. Then, they are asked to force rank each brand along each attribute.
- Market Research and Feedback:
- Focus Groups: Beyond surveys, focus groups are a valuable tool for gathering importance and performance data in a more qualitative way. These small (typically 8 – 12 people), interactive discussions allow you to explore customer preferences in depth, uncovering the reasoning behind their choices and the attributes they value most. The insights gained here can help refine the attributes included in your I-P Map, ensuring they are genuinely reflective of what your customers care about. The sample size is small, but this can be a great tactic to use at the beginning of a I-P Map project that then supplements focus group findings with a broader, larger sample survey.
- Customer Feedback and Reviews: Real-time feedback from customers, whether through online reviews, social media, or direct feedback channels, offers a wealth of information about how your brand is perceived. This feedback can reveal recurring themes and concerns, highlighting which attributes are most frequently discussed — positively or negatively. Data that is already coded on a scale (e.g., stars given to your restaurant and its competitors on an online review site like Yelp) can be pulled directly into the I-P Map framework. By integrating this feedback into your data collection, you ensure that your I-P Map reflects real-world and real-time perceptions and priorities.
- Internal Data:
- Performance Metrics: Internally collected data — such as service speed, product defect rates, or customer satisfaction scores — provides an objective measure of how well your brand is performing in key areas. This data can be compared against customer perceptions gathered through surveys to identify any gaps between actual and perceived performance. For example, if internal metrics show high product quality but customers rate it poorly, this discrepancy could signal a need for better communication or further investigation.
- Competitive Analysis: Benchmarking your brand against competitors adds another layer of insight. By understanding how your brand’s performance compares to that of your competitors on the same attributes, you can see where you’re leading the pack and where there’s room for improvement. This competitive context helps you position your brand more effectively in the market and make informed decisions about where to focus your resources.
Collecting data from these diverse sources ensures that your Importance-Performance Map is grounded in reality, reflecting both the subjective views of your customers and the objective performance of your brand. By integrating survey results, qualitative insights, and hard data, you create a robust foundation for your I-P Map, allowing you to make strategic decisions that truly resonate with your customers and drive business success.
How is the Data Processed?
Once you’ve gathered the necessary data for your I-P Map, the next step is processing and analyzing it to uncover meaningful insights. Here’s how the stages of this process unfold:
- Data Cleaning and Preparation:
- Before analysis can begin, it’s crucial to clean and prepare your data. This involves checking for incomplete or inconsistent responses — such as missing ratings or contradictory answers — and addressing them appropriately. Data cleaning might include removing outliers, normalizing scores, or standardizing responses if the data was collected from multiple sources using different scales. The goal is to ensure data accuratcy and meaningfulness.
- Calculating Mean Scores:
- With your data prepared, the next step is to calculate the mean scores for both importance and performance across each attribute. For example, if customers were asked to rate the importance of factors like price, quality, and customer service, you would average these ratings to determine the overall importance score for each attribute. This determines where each attribute sits on the vertical axis. Similarly, you calculate the mean performance score for each brand for each attribute. These mean scores determine where each brand sits on the I-P Map’s horizontal axis.
- Mapping the Data:
- Once you have your mean scores, you can begin mapping the data on a two-dimensional grid. The vertical axis of the I-P Map represents the importance scores, while the horizontal axis shows the performance scores.
- Each attribute for each brand is plotted as a point on this grid based on its calculated mean scores. Thus, if you have scored 5 brands (including yours) along 5 attributes, your I-P Map will contain 25 data points.
- When plotting multiple brands, it is a good idea to utilize a different shade of a color for each brand. For example, plot your brand’s 5 attributes in a dark blue, your closest competitor in a slighter lighter shade of blue, and so on until all competitors are plotted using a distinct color. With the brands distinguished using color, apply text labels to each of the attributes — which, if the framework is mapped correctly, will group naturally along horizontal planes, since each attribute has its own vertical placement. That sounds confusing, but it will make perfect sense when you plot your first I-P Map.
- The placement of these points on the map helps visualize how your brand’s performance aligns with what customers consider most important, providing a clear view of strengths and areas for improvement.
This process turns raw survey data into a strategic tool for enhancing customer satisfaction and guiding business decisions. By following these steps carefully, you will create an I-P Map that offers valuable insights into how your brand is perceived relative to customer priorities.
Interpreting the I-P Map and Taking Action
Once your I-P Map is complete, the next step is to interpret the results and translate these insights into actionable strategies. Each of the I-P Map’s four quadrants represents a different strategic imperative. Here’s how to take action on these quadrants:
- Keep It Up (High Importance, High Performance):
- Continue to prioritize and maintain high standards in these areas.
- Ensure that resources are allocated to preserve these strengths, as they are critical to maintaining customer satisfaction and loyalty.
- Concentrate Here (High Importance, Low Performance):
- Focus your efforts on improving performance in these attributes. This might involve investing in quality enhancements, training staff, improving processes, or addressing any specific issues identified in customer feedback.
- By elevating your performance in these areas, you can significantly boost customer satisfaction and potentially gain a competitive edge.
- Low Priority (Low Importance, Low Performance):
- While it’s important to monitor these attributes, they may not need substantial investment at this time. Resources might be better allocated to more critical areas.
- However, keep an eye on market trends—what’s low priority today could become more important in the future.
- Possible Overkill (Low Importance, High Performance):
- Consider reallocating resources from these attributes to areas in the “Concentrate Here” quadrant.
- While maintaining a baseline level of performance is important, you may not need to invest heavily in these areas if they don’t align with customer priorities.
Strategic Implementation
Interpreting the I-P Map helps you take concrete steps to align your brand’s performance with what matters most to your customers. In my experience, the two most important areas of the graph are at its vertical top.
By focusing on areas identified in the “Concentrate Here” quadrant, you can make the most impactful improvements, addressing the attributes that will most enhance customer satisfaction and loyalty.
At the same time, maintaining strengths in the “Keep It Up” quadrant ensures that you continue to deliver value where it counts. By balancing your resources effectively across these areas, you can optimize your strategy, enhance your brand’s market position, and drive long-term success.
Remember, the I-P Map is a dynamic tool. As customer preferences evolve, regularly updating and reassessing your I-P Map will help you stay ahead of changes in the market, allowing you to continue making data-driven decisions that resonate with your customers.
Conclusion: Leveraging I-P Maps for Competitive Advantage
I-P Maps are more than just a visual tool; they are a strategic asset that can guide your brand’s decisions. By understanding not just where you stand relative to competitors, but also what truly matters to your customers, you can make informed decisions that resonate with your target audience.
The key is to gather accurate, meaningful data that reflects your customers’ true priorities. With this information, you can ensure that your brand not only competes effectively but also delivers on what matters most.


