

I love data, especially customer data. There are few things I enjoy more than putting on my Data Analyst hat and diving into a transaction log, looking for trends and insights that can assist my clients (or my own businesses) in making more informed decisions.
In today’s post, we are introducing a new series called “My Favorite Analyses” which we will publish every month or so. In it, we will dive into various analytical techniques that have greatly influenced my work and contributed to the success of numerous companies. To kick things off, we’ll explore the Customer Cohort Chart (C3), a valuable tool for gaining insights into customer behavior over time and my absolute favorite thing to do with customer data.
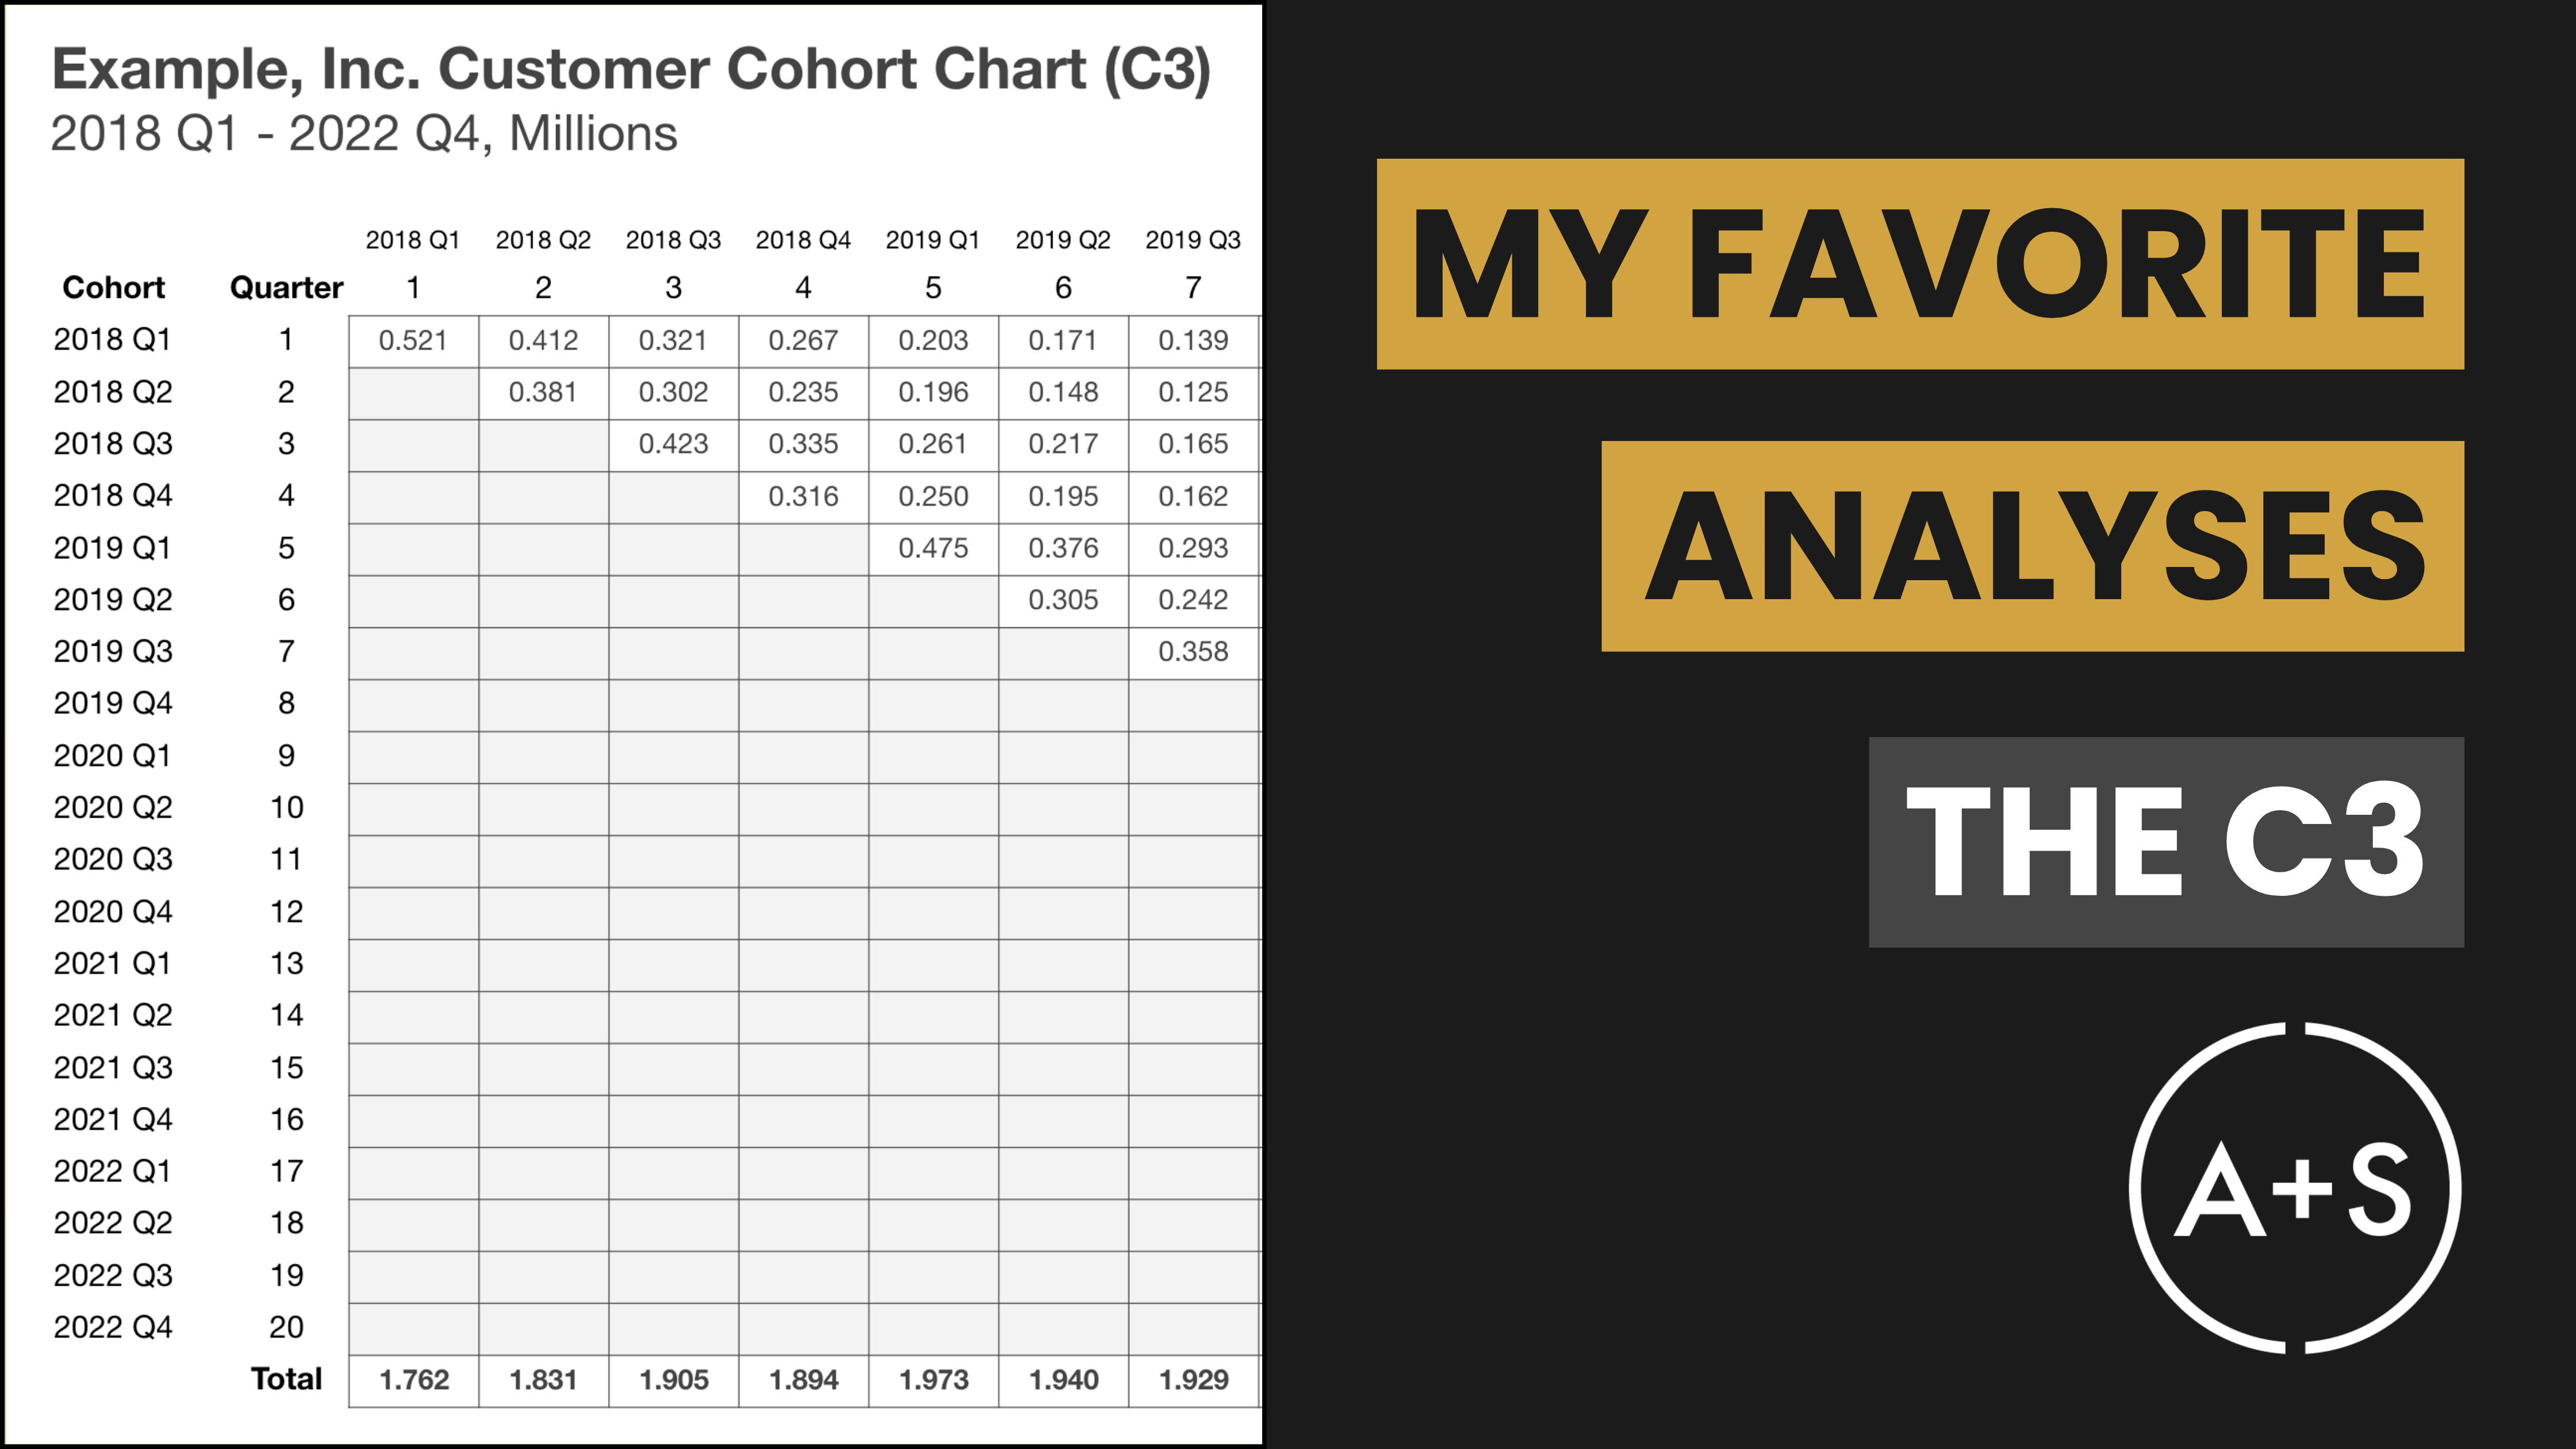
What is a Customer Cohort Chart (C3)?
The Customer Cohort Chart (C3) is a method that monitors the actions and success rates of various groups of customers (cohorts) who have a shared characteristic, usually their acquisition date (the first day they made a purchase with the company). While customer cohorts could be grouped by the day they were acquired, it typically makes more sense to organize the cohort groups around monthly or even quarterly periods.
By examining these groups, we gain valuable knowledge and insights into areas like customer loyalty, buying habits, and overall potential lifetime value. Conducting a C3 analysis can also provide insights into the effectiveness of our marketing campaigns.
Why C3 Matters
By studying the behavior of different groups of customers over time, we can determine patterns and use data to inform decisions that can enhance retention rates and boost overall customer value. For instance, our analysis may reveal that customers acquired in the first quarter exhibit a higher retention rate than those acquired in the third quarter. This could prompt us to investigate and replicate the successful marketing tactics utilized during the first quarter, whether those tactics were a particular offer or involved targeting a specific consumer segment.
Creating the C3: A Step-by-Step Guide
To build a C3, you’ll need to have three pieces of data in a nicely structured table: (1) the unique Customer IDs for each of your customers; (2) the period that they made their first purchase with you (we call this the “Acquisition Period”); and (3) the subsequent periods that they made purchases (we call this metric the “Purchase Periods”).
The most reliable data comes from a record of customer transactions, where every purchase is recorded and linked to a specific individual. Analyzing this information allows you to determine the best time frame (i.e., “Period”) for your business’s performance evaluation. Usually, that is monthly or quarterly.
If you’re analyzing a monthly subscription business, the period is naturally set to monthly. But if you’re examining a business where customers purchase inconsistently, such as a retail store where customers shop at their convenience, you may need to extend the period to quarterly if transactions occur infrequently.
With transaction-level data you can group the purchase dates by the Period you’ve chosen. The earliest Period for each unique Customer ID becomes the Acquisition Period for that customer.
However, if you lack access to detailed transactional data, you can still estimate a company’s C3 performance using metrics like customer acquisition rates and retention numbers, though this method may be more challenging. (These figures can often be found in financial reports for public companies, but that is a topic for another newsletter).
Once you have all of your data collected, it is time to create your C3. You will find a comprehensive guide on how to do this in Google Sheets using a pivot table through the link here. At a high-level there are a few key steps you will need to follow:
-
Gather Your Data: As mentioned, you need three key pieces of data — Customer ID, Acquisition Period, and Purchase Period. Ensure your data is structured with these columns to facilitate easy analysis.
-
Create the C3 Table: Using Google Sheets or Excel, create a pivot table with Acquisition Periods as rows and Purchase Periods as columns. You can also do this in R or Python if you’re dealing with transaction files too large for a spreadsheet. This will allow you to see how each cohort performs over time.
-
Populate the C3 Table: Group customers by Acquisition Period and count the number of them who made a purchase is each Purchase Period. This step is crucial for visualizing the number of unique customers contributing to sales in each period.
-
Analyze for Insights: With your C3 chart ready, you can now analyze it to understand customer retention rates, identify successful acquisition periods, and make strategic decisions based on data trends.
Analyzing the C3
With your C3 now in place, it’s time to delve into its details.
Acquisition Patterns: The first number in each row (which forms a 45° line) indicates the number of customer acquired in each cohort. These numbers highlight successful acquisition campaigns.
Survival Rates: Look across the rows to see how the number of active customers from each cohort change over time. A steep decline might indicate retention issues.
Retention Rates: Add up all the active customers in the columns (being sure to include any customers who were acquired before the time horizon of your C3 analysis) to see how the company is retaining customers over time. Tracking this can yield insights into the overall health of the business.
Comparing different cohorts to one another uncovers what strategies lead to higher acquisition, retention, and repeat purchases.
Real-World Application
I’ve conducted C3 analysis for every company I’ve worked with that has shared customer data with me. Consistently, this analysis provides numerous answers and, perhaps more importantly, raises a variety of questions. This invariably leads to more in-depth discussions, further analysis, and increased customer understanding.
In a case study by Dan McCarthy and Peter Fader, two pioneers in customer-based corporate valuation (CBCV) and other analytical approaches that contribute to customer-centricity, the use of a C3 was pivotal in valuing companies like Slack Technologies, Dropbox, Lyft, and luxury marketplaces the RealReal and Farfetch. You’ll find a link to a great discussion of CBCV and the C3 here.
Ultimately, implementing C3 analysis in your business can offer a clear understanding of your customer base’s evolution and the factors influencing their behavior. Such insights are crucial for strategic planning, marketing investments, and enhancing customer relationships.
Final Thoughts
C3s are not just visualization tools; they provide a lens for understanding and enhancing customer value. I recommend integrating this analysis method into your toolkit to experience the difference it can make in your strategic decisions.


