We’ve all had the experience of spending weeks slogging through messy datasets, organizing, analyzing, and synthesizing our thoughts to compile a meticulous (and, to our own eyes, objectively beautiful!) 40-slide presentation. Feeling confident in our work, we send it to the client … only to hear them say they’ll “get back to us” on the deck at some unspecified later date.
All that effort for a quick brush-off is disheartening. But don’t despair. The issue rarely lies in your underlying numbers or analytical rigor; it lies quite literally in your presentation.
When executives and clients open an email with a massive slide deck, the sheer volume can overwhelm them. That is why an indispensable skill for any high-performing analyst is learning to consolidate complex findings into a concise, high-impact 1-page memo.
Where the Breakdown Occurs
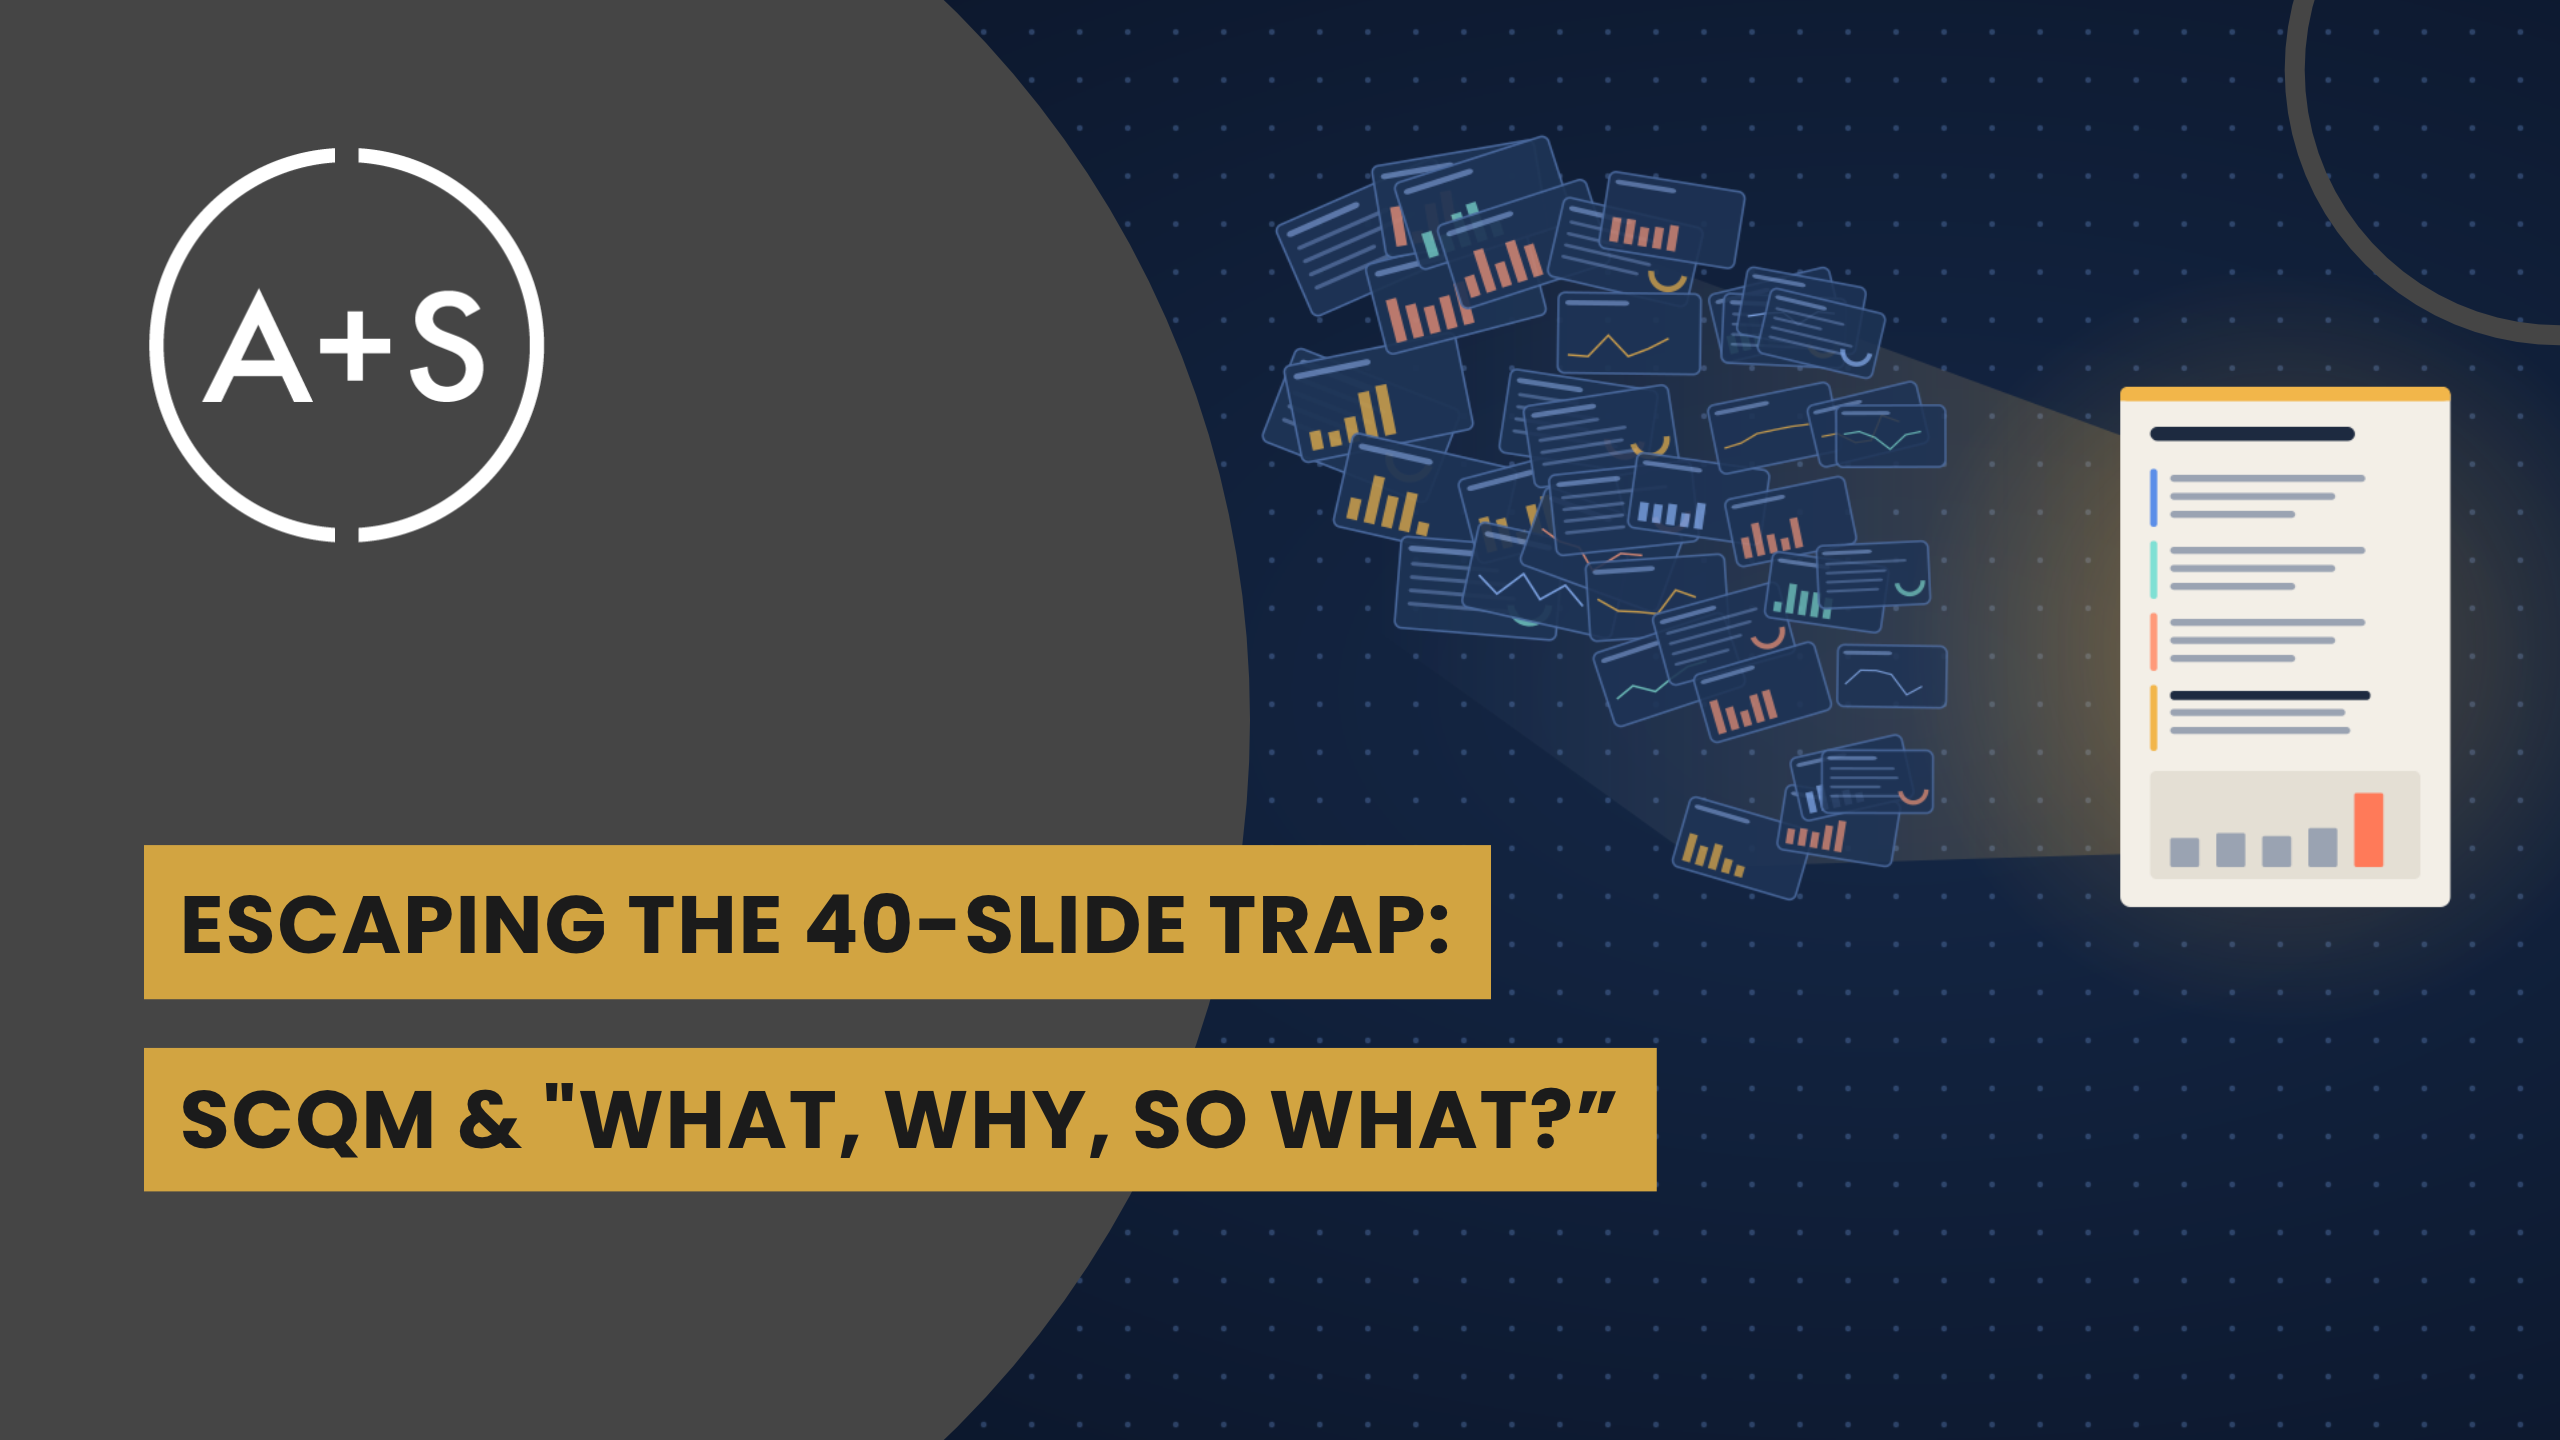
To communicate with stakeholders more effectively, we have to recognize where the breakdown happens. While the human mind is capable of incredible strategic reasoning, it is highly susceptible to cognitive fatigue. Presenting a busy executive with a 40-slide deck rarely reads like the thorough deep dive you intended. Instead, it feels like handing them a task they just don’t need. To a busy executive, opening an email with a large slide deck feels like being handed a haystack and told to find the needle.
This problem often stems from the “false hierarchy” trap of storytelling, an issue we’ve discussed in previous newsletters, where analysts are tempted to present their analysis chronologically. When we fall victim to this trap, we are explaining our own journey of discovery rather than delivering the crucial information the stakeholder actually needs.
When confronted with an exhaustive narrative of queries run and dead-ends explored, a busy client with limited time is liable to leave the meeting knowing nothing of importance—or worse, misinterpreting the analysis and coming up with their own story.
The job of an analyst isn’t to demonstrate effort or sell the difficulty of the challenge faced; it is to make it easy for the stakeholder to understand the story locked in the data. The best analysts prioritize the most consequential takeaways and deliver direct, decision-ready clarity by condensing 40-slide decks into easy-to-understand stories.
The Solution
Condensing comprehensive analysis into digestible briefs means abandoning chronological order. Instead, build your presentation around frameworks that fit executive logic: The SCQM Method and the “What, Why, So What?” Framework.
- Pillar 1: The SCQM Method Pioneered by the brilliant Barbara Minto (creator of the legendary Minto Pyramid Principle at McKinsey), this model aligns your story with the exact sequence executive brains use to make decisions. It provides the clean narrative structure needed to present critical findings without clutter:
- Situation (S): State an uncontroversial baseline fact that grounds the discussion. Example: “Our digital acquisition channels consistently add 10,000 active subscribers per month.”
- Complication (C): Introduce the operational or strategic tension that challenges that baseline. Example: “However, 40% of new users churn within 30 days, generating a $500k monthly revenue loss.”
- Question (Q): Frame the core strategic challenge created by that complication. Example: “How do we adapt our onboarding flow to protect subscriber lifetime value?”
- Main Message (M): Deliver your direct recommendation or strategic solution upfront. Example: “By simplifying our onboarding UX, we can cut 30-day churn in half and recapture $250k in quarterly revenue.”
- Pillar 2: The “What, Why, So What?” Framework Once you state your primary recommendation, your only remaining job is substantiating it with evidence. Analysts often stumble here by dumping every chart they generated into the story’s body. Cut the noise and address the three questions stakeholders are actively asking themselves:
- What happened? Provide objective quantitative proof. Include the single “smoking gun” metric or visualization that proves the complication is real, sizable, and urgent.
- Why did it happen? Pair that quantitative metric with qualitative human context. Use representative customer support logs, survey responses, or user interview quotes to reveal the behavior driving the numbers.
- So what? Translate the analytical discovery directly into business reality. Quantify the exact P&L impact, risk exposure, or runway effect for that specific leader’s domain.
Pairing Barbara Minto’s narrative sequence with “What, Why, So What?” allows you to take an exhaustive slide deck and distill its strategic value onto a single page. Your stakeholders get the complete picture in five minutes rather than fifty, and you get immediate alignment on next steps.
Conclusion
Mastering this format protects your credibility and ensures your insights don’t get lost in cognitive overload. While complex models and deep analyses are essential behind the scenes, clear and rapid communication is what turns numbers into action. The quality of an analysis is never measured by slide count; rather, it is evaluated on its ability to drive decisions.
Remember KISS: Keep It Simple, Statisticians!
Until next week, Keep Analyzing!