

Today we are going to tackle a question far too many data analysts fail to consider: How do I build a plan for a data analysis project?
Look, we data analysts love data. It’s the first word in the job title we use to distinguish ourselves from garden variety business people. We are finely tuned professionals who add value by working with data. We simply must jump right in and start flexing those skills, right?
Wrong.
If you don’t take the time to build an effective (although flexible) plan at the beginning of your data analysis project, you’re going to fail. Simply and forever.
Here are the six steps to building a plan.
Why do I need a plan?
Taking time upfront benefits you in many ways. It will force you to document the context of your analysis, clearly articulate the hypothesis you hold, express the important questions you will investigate, and identify the data you will collect (and where those data are found). A plan will give you a North Star for guidance through the initial steps of your analysis journey, which can be a confusing and frustrating part of any project.
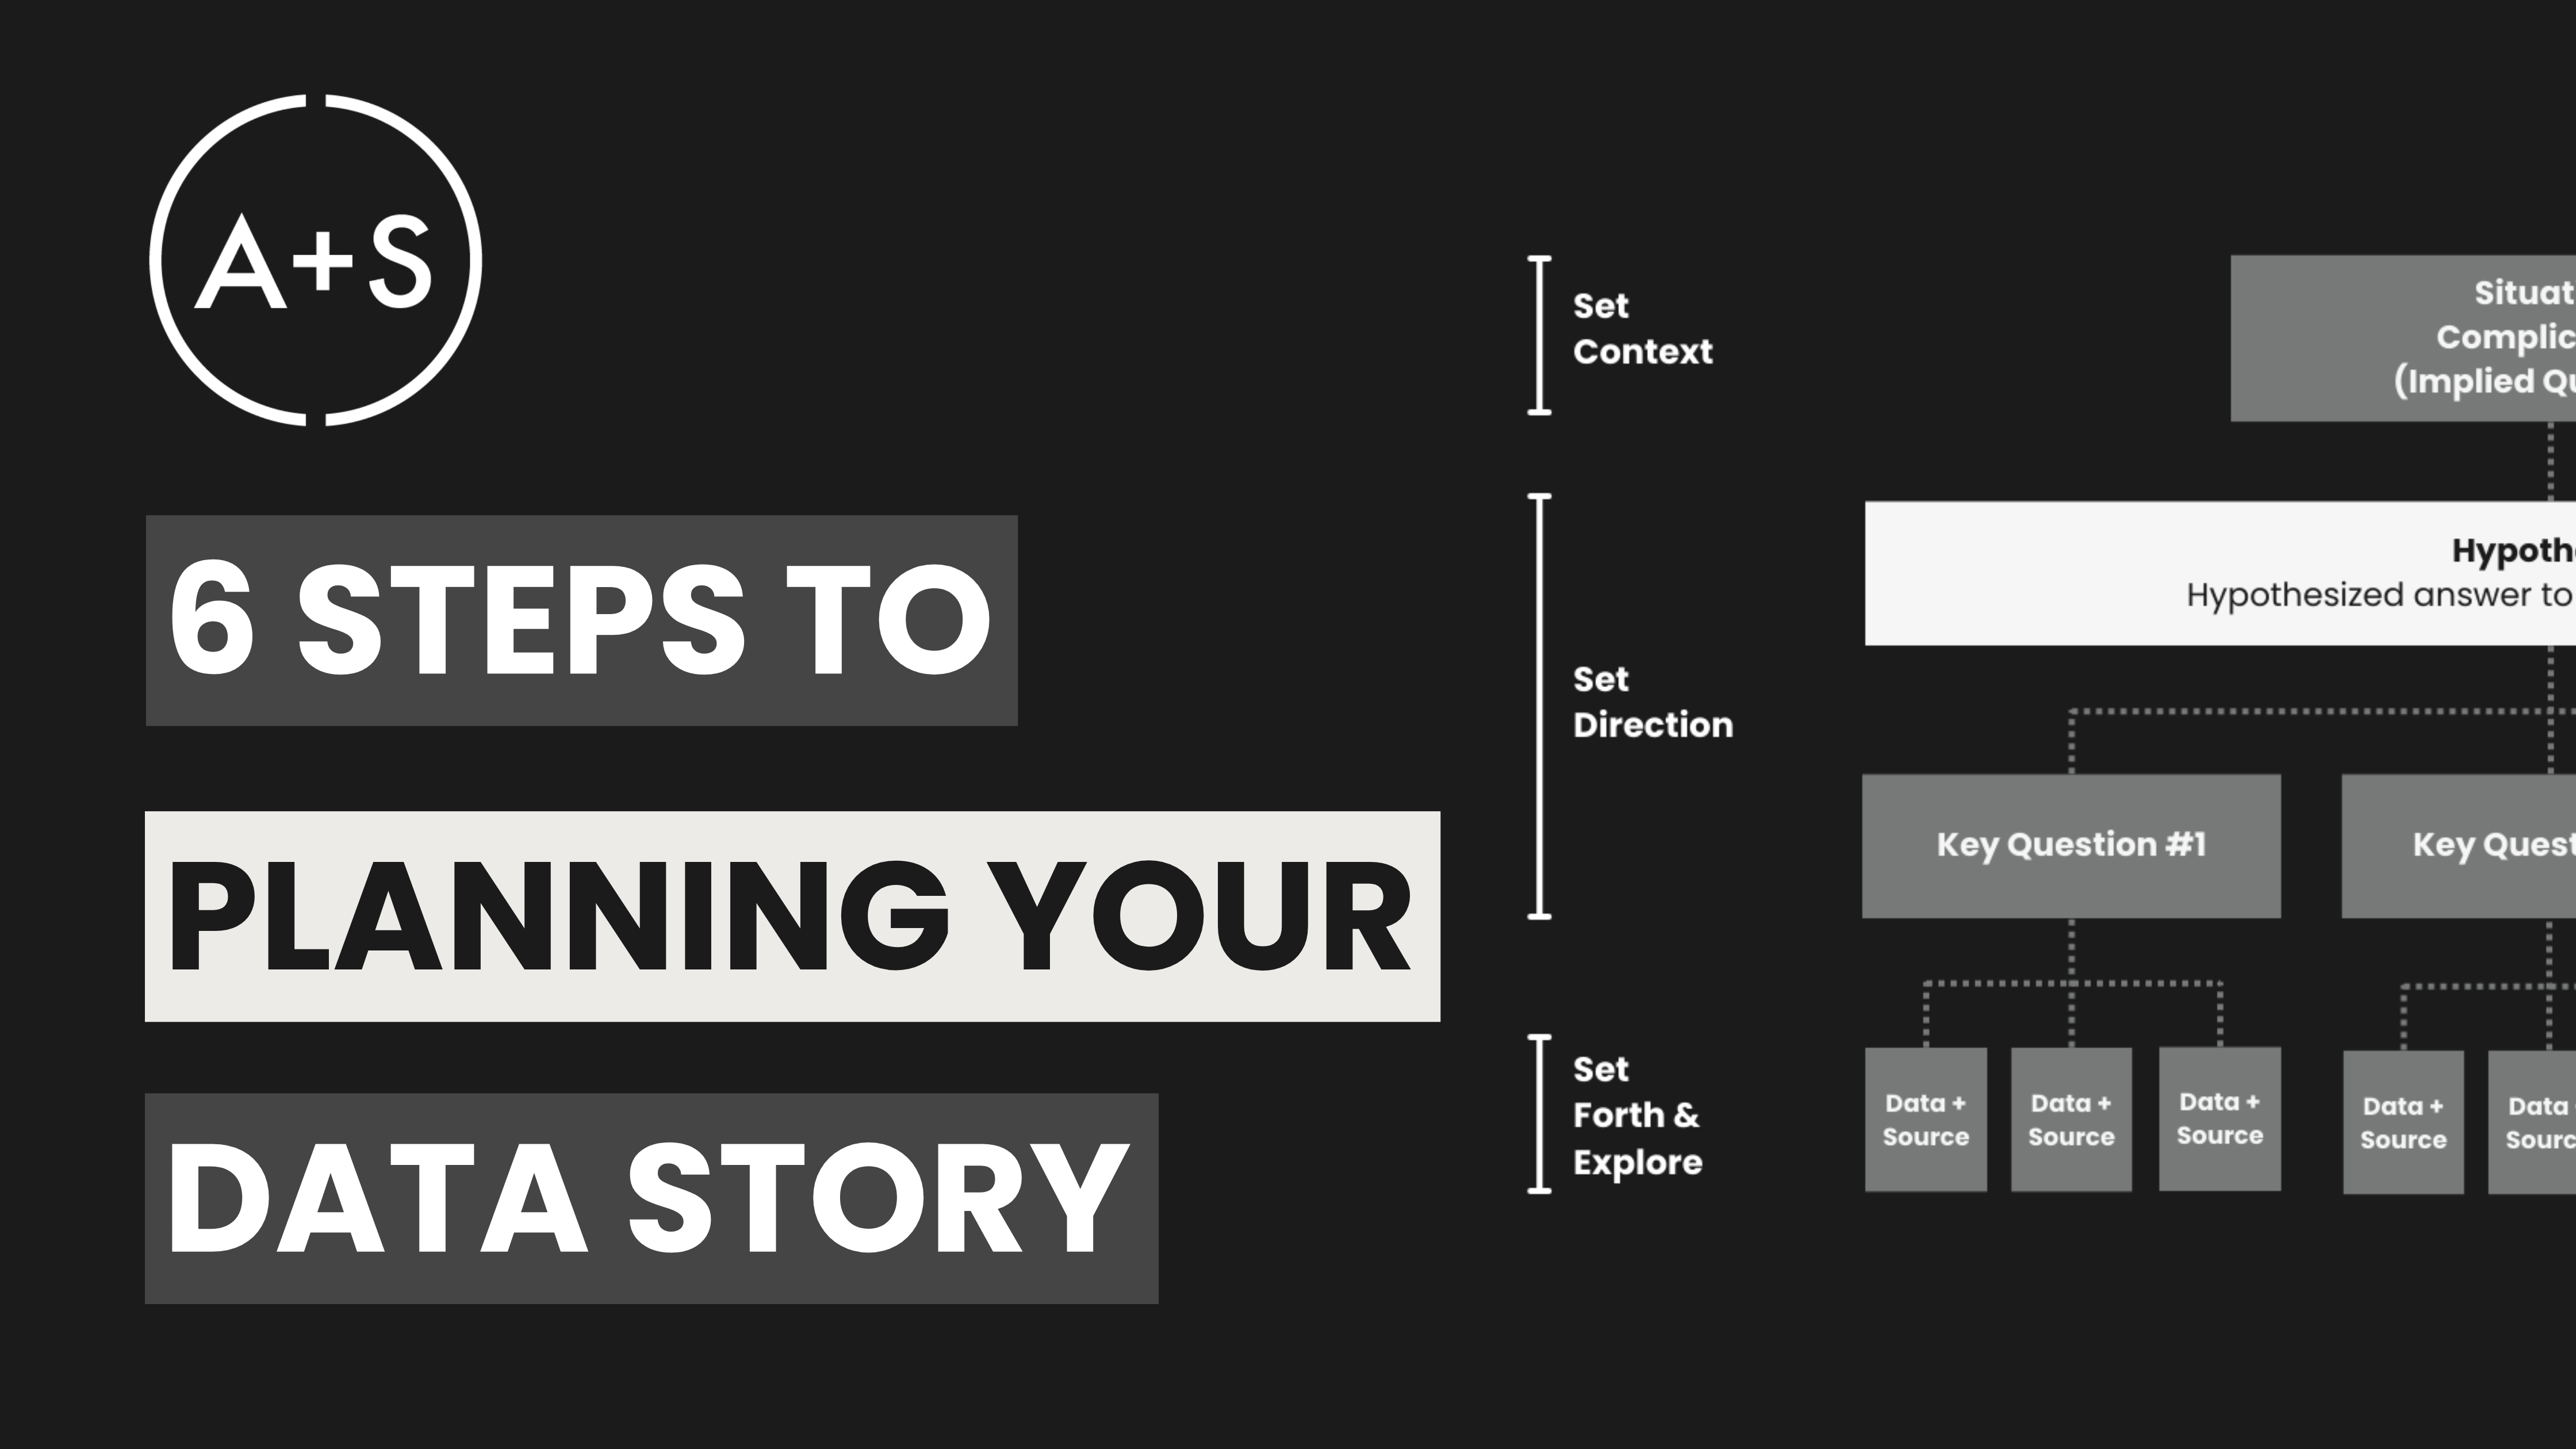
Introducing the pyramid model
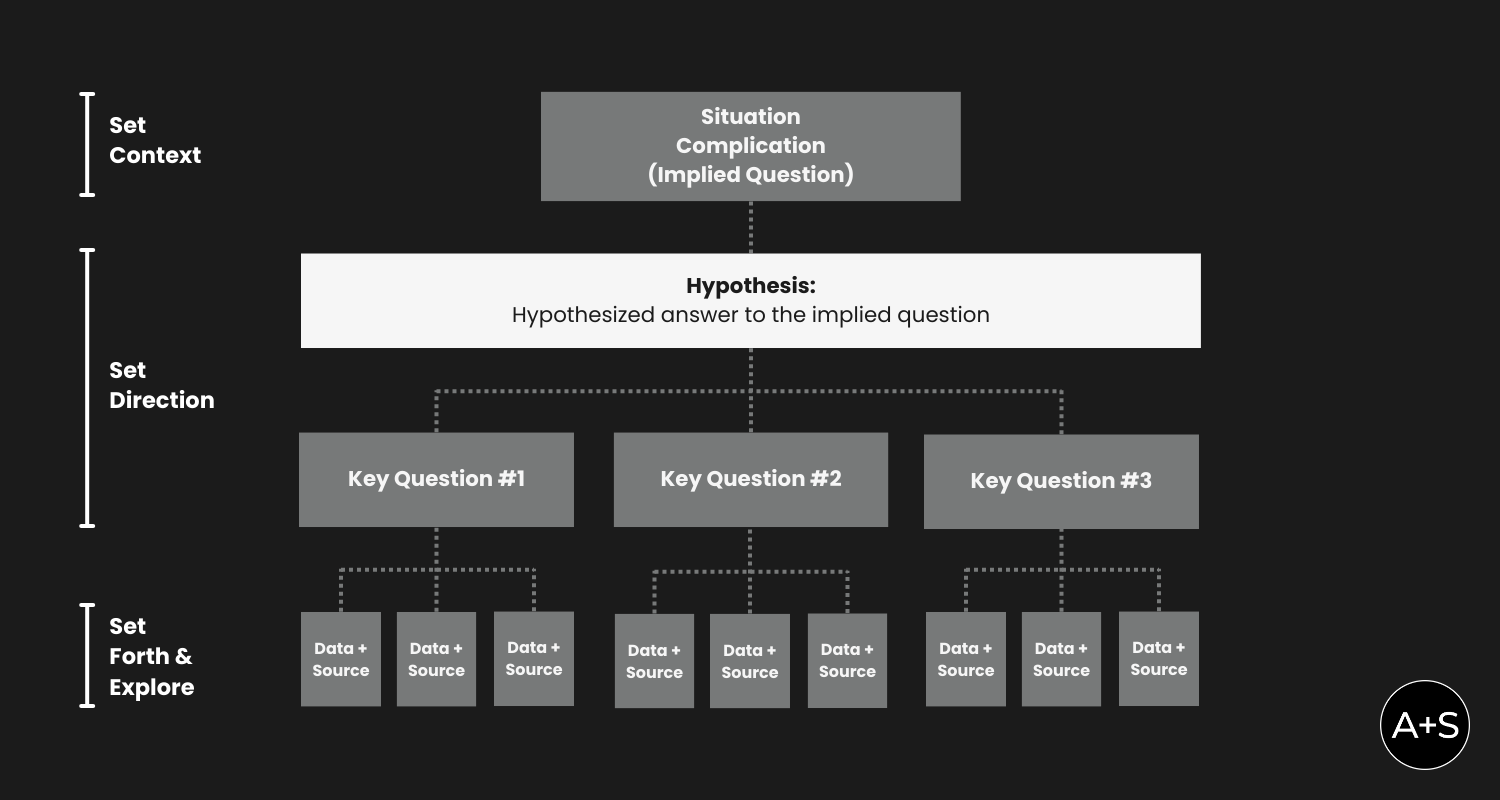
In my experience, designing a plan in a pyramid layout works best. It structures all the important elements of my analysis while allowing for quick modifications later on. Here’s what I use to guide my projects:
When you build your plan, you’ll need to fight the urge to start at the top of the pyramid and work your way down. That may seem intuitive, but it’s the hardest path you could take – fraught with writer’s block inducing complexity and time-wasting rabbit holes.
Instead, follow the process described next. You are going to jump around a bit as you build your plan piece by piece. But it is the most efficient and effective way to approach your plan. As things take shape, you’ll see the story emerge and you’ll spend much less time.
Step 1: What Subject are we talking about here?
Begin by establishing what the whole project is about. If you’ve been asked to figure out why click through rates on a campaign were so low, your project is about Click Through Rates. If you’re investigating ways to improve process efficiency in your plant, your project is about Process Efficiency. This is the “Subject” of your project and, ultimately, your data story.
The fact that you usually get this information at the beginning of the project directly from your stakeholder doesn’t eliminate the need to challenge it. You must ensure that you can point to empirical data that supports the Subject. If you can’t find such evidence or you find evidence that contradicts the Subject they’ve provided, your project will only be successful if you explore the new competing Subject. Build consensus by discussing possible Subjects for your analysis with stakeholders and landing on one that has the most support.
Once you have it, place this Subject in your pyramid’s Hypothesis box.
Step 2: What are we answering about this Subject?
After you’ve confirmed the Subject, articulate the question you’re answering for your stakeholders about that Subject. Place that question in the “Implied Question” line of your introduction. We call it an “Implied Question” because, often, it’s so well understood that it doesn’t need to be stated out loud. Hence, it is implied.
Implied Questions data analysts often pursue include:
-
How can we eliminate operational inefficiencies?
-
What ROI have we earned from digital media investments?
-
What’s the most profitable market for our new product launch?
Similar to the Subject, the Implied Question you’re answering is often the one stakeholders have presented to you or hired you to investigate. And just as you mustn’t blindly accept the Subject your stakeholders provided, you must ensure that the question your analysis will answer is the right one.
The importance of getting the Implied Question right can’t be understated. Far too often, analysts rush off to answer questions they’ve been tasked with investigating only to find – after expending loads of time and energy – that the answers offer little benefit or don’t address their stakeholders’ true challenges.
Step 3: Draft a hypothesis
Armed with the Implied Question, document a potential answer that seems plausible to you – your “Hypothesis.” Keep in mind that this is just an initial assumption, as you haven’t yet gathered and analyzed any data to support your answer. It’s okay if you’re not accurate – the analysis you conduct will unearth objective evidence to test your Hypothesis. Your goal at this point is to articulate a “most likely” answer that you will investigate further.
Create a concise Hypothesis by combining the identified Subject with one action. For example, your Hypothesis could read: “Company X can improve its Click-Through Rates by improving ad copy quality.” Here, Click-Through Rates (the Subject) has been joined by the action of “improving ad copy quality.” Again, it’s a hypothesis – you don’t know if it’s true, but you do want to see if it’s true. That’s the purpose of the project.
Prohibit the use of the word “AND” from the statement to avoid mixing multiple ideas. Keep the Hypothesis straightforward and efficient, and expand it later if necessary based on what you find in the data. For now, simplicity is key in order to move with purpose. If you have additional Hypotheses you want to test, you have additional data analysis projects to document.
Step 4: Fill in the context
Complete the full context of your plan by documenting the “Situation” and “Complication” surrounding your project. It’s most effective to build these two elements together, as they are intrinsically linked.
The Situation is an uncontroversial statement of fact that sets the foundation for your Hypothesis. It’s a shared understanding among everyone involved in the project (e.g., “Company X has a strong track record of leading their industry.”) and something that has been impacted by the Complication. The Complication is the disruption in the current Situation. It could be a threat from competitors (“New players in our industry pose a risk to our standing”) or an opportunity for growth and success (“Implementing new technologies can solidify our position as leaders in the industry”). The Complication is usually well known, as it is the driving force behind the project. There is no need to overthink it.
The combination of Situation and Complication is what triggers the Question in your stakeholders’ minds. There should be a smooth, natural transition from Situation → Complication → (Implied Question) → Hypothesis. It should read like a high-level summary of your project. If the pieces don’t fit together, continue refining until your narrative flows logically and effortlessly.
Step 5: Build the Key Line
The “Key Questions”, collectively referred to as the “Key Line”, is the foundation of your analysis. These are the main questions we will explore through collecting and analyzing data. They represent what we do not yet know, but hope to discover through our research. The questions are directly linked to our initial Hypothesis — the answers we find will ultimately determine whether our Hypothesis is true or not.
There are two important considerations when documenting your Key Line. First, the questions must follow the MECE principle (Mutually Exclusive, Collectively Exhaustive). This concept, pronounced “meese” (rhymes with “geese”) was introduced by Barbara Minto in 1987 and it means that there should be no overlap between the Key Questions you identify. Each question should be unique and explore a different aspect of your Hypothesis. Additionally, these questions should collectively cover all critical aspects of your Hypothesis so that nothing important is left out.
A second important principle to keep in mind is that at some point, you reach a number of Key Questions that would overwhelm your analysis (or, more importantly, overwhelm your audience when you try to tell them about all the things you looked at). Conventional wisdom argues that seven Key Questions is a maximum allowable number but, in my opinion, a story that contains as few as three separate ideas can produce a full, robust story. If the number of Key Questions is going well beyond three, be absolutely sure that your Key Line is MECE. Often, combining and consolidating questions leads to a more concise and powerful story.
Getting to the “right” questions in the Key Line involves more art than science. In my experience, the best way analysts can identify a solid Key Line is by placing themselves in their stakeholders’ shoes. What questions would your stakeholders expect you to answer once they hear your Hypothesis? Draw these critical questions from your stakeholders as you discuss the project with them. Listen carefully for stakeholders’ areas of concern during your discussions or pull ideas from them by asking broad, open questions (e.g., “What do you believe are the biggest challenges to [insert your Subject here]?”).
Step 6: Identify the Data & Data Source
The last step in creating your plan is documenting the data you’ll need. For each Key Question, consider what information is required to answer it and where that information can be found. Remember these definitions:
-
Data: A metric, Key Performance Indicator (KPI), or measure that will be collected and analyzed.
-
Source: The location where the data can be accessed, such as a database, survey, or report.
At this stage, there should be no limitations on the data and sources you identify. In other words, this is a creative exercise where you are constructing a wishlist of desired information. By not limiting yourself based on factors such as cost or time constraints, you will avoid biased thinking that could hinder analysis during the planning phase. It’s important to focus on identifying the necessary data rather than settling for what is readily available.
The most important thing you must keep in mind at this step is to find data that will answer each Key Question. Identifying the right data and data source requires experience. The more you become familiar with data that’s available to you, the easier it will become to assemble your list of ideal data quickly. But remember, this is simply a plan at this point. If the data you identify turns out to be unavailable or wrong, you can pivot to other more accessible or valuable data and update your plan.
Remember to manage expectations if constraints do arise and limit access to specific data or require use of proxy data instead. Communicating openly about any challenges faced while collecting data will help ensure a collaborative and effective planning process.
Keep biases at bay
Bias can hamper the planning phase severely. When bias is allowed to creep into the planning process, it can lead the analyst to waste time investigating the wrong set of questions and, more importantly, draw false conclusions. Analysts should be aware of two important biases: accessibility bias and anchoring bias.
Accessibility bias occurs when people make assumptions based on the limited information they have in front of them and fail to seek out additional data. This leads to a narrow analysis and a narrow result. To combat this, think outside the box when you detail the data you want to collect for your project. Remember that you must collect the data you need to conclusively answer the questions you’re investigating, not simply the data you have on hand.
Anchoring bias, or focalism, can hinder analysis by leading analysts to focus their plan on a familiar reference point rather than the full picture. The key to overcoming this bias is perspective – a wider range of data, outside perspectives, and new comparisons can challenge the initial focal point. In the 1960s, Pepsi struggled to overtake market leader Coke until they shifted their focus from attempting to match Coke’s iconic bottle shape to addressing consumer preferences by introducing new, innovative products. This led to the birth of the two-liter soda bottle. Pepsi’s shift in research planning led to success in reframing their analysis.
The final result: A Data Story outline
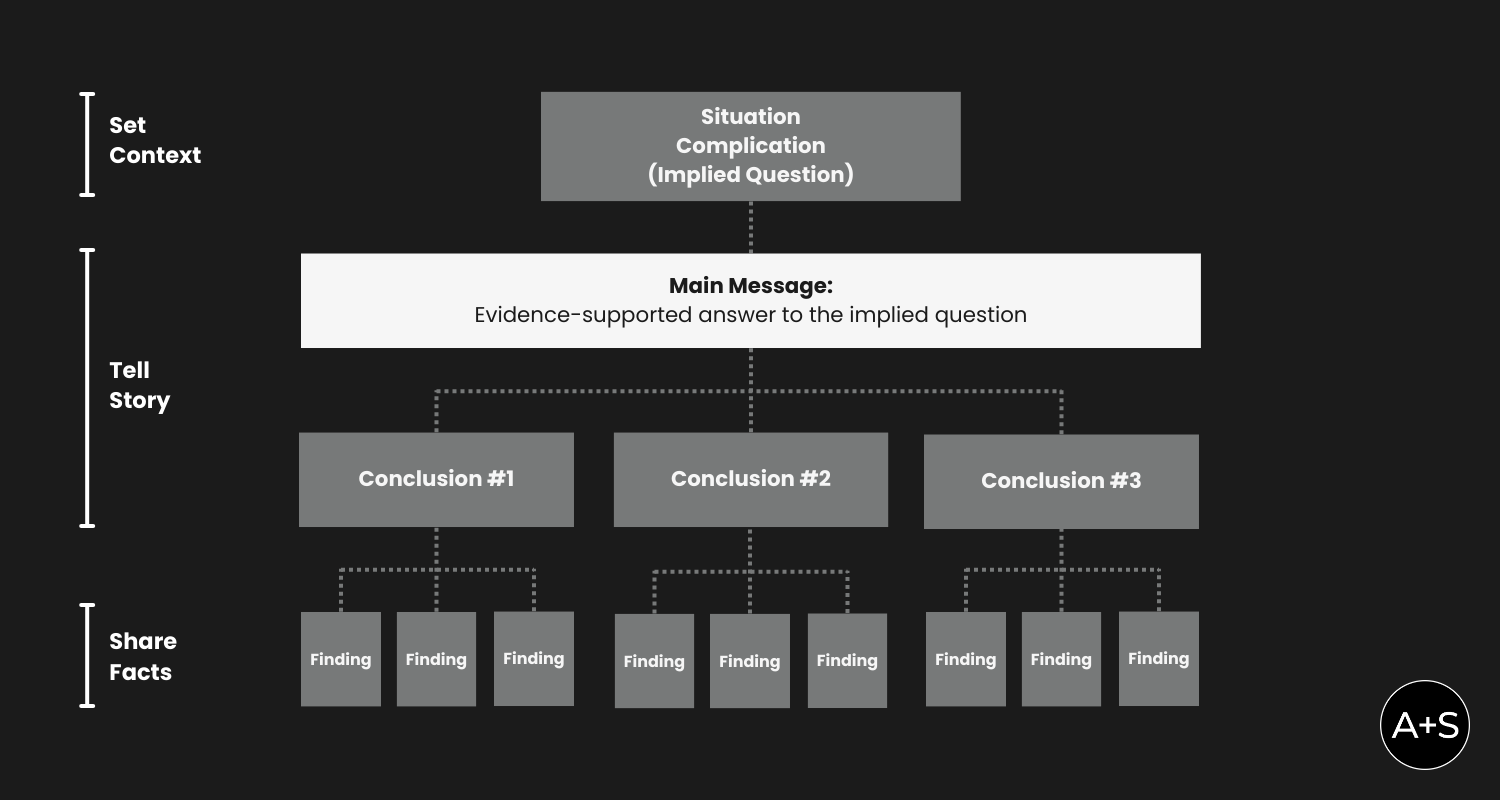
Now with a plan in place you can finally get your hands on some data! As you wind through your project – collecting, cleaning, analyzing, and interpreting data – you’ll come upon findings that answer the questions you’ve detailed in your Key Line. Doubtless you’ll also unveil some findings that you weren’t expecting. This is the fun of data analysis.
Your plan helps you document your narrative as it slowly reveals itself. You’ll start by replacing the “Data + Data Source” fields with the succinct findings revealed in those data. Next, you’ll summarize the findings as conclusions that answer your Key Line questions. As you sort through how these new, unexpected findings impact your conclusions, your plan will adapt along with you. These conclusions will help you flip your untested Hypothesis into a Main Message for your Data Story rooted in objective evidence. Ultimately, your planning document becomes the outline for a fact-based Data Story that expertly sets its context, perfectly addresses the questions on your stakeholders’ minds, and delivers findings in an organized, logical way.
Your outline will look something like this:
Keep in mind that strategic planning is not just a task of creating documents; it’s a meticulous process of charting a definitive path that guides your entire data analysis project. It involves carefully considering all factors and potential obstacles, and devising a comprehensive plan that will lead to ultimate success. A well-crafted strategic plan is akin to a map that lays out the most efficient route towards achieving your goals. Without it, your project may become directionless and prone to getting lost in the vast landscape of data analysis. Taking the time to strategize and develop a solid plan is crucial for ensuring the effectiveness of your data story.


