

Today we are resuming our “My Favorite Analyses” series which takes a deep-dive look at the most important and impactful ways to extract insights from raw data, enabling informed decision-making. In previous MFA posts we looked at the customer cohort chart (C3) and customer lifetime value (CLV). We are now introducing a third customer-focused analysis tool, one that is much more tactical than the previous two: the Recency-Frequency Matrix.
We all know that understanding customer behaviors is important for any business. The challenge, however, is translating those behaviors into actionable insights. This is why the simple elegance of the Recency-Frequency Matrix makes it such an indispensable analysis for a business and such an important tool for an analyst. By focusing on how recently and how often customers make purchases, this approach offers straightforward recommendations that maximize marketing efforts.
Understanding Traditional RFM Analysis
The Recency-Frequency Matrix is a product of a traditional customer segmentation done using RFM analysis, which stands for Recency, Frequency, and Monetary value. This model evaluates customers based on:
- Recency: How recently they made a purchase.
- Frequency: How often they make a purchase.
- Monetary Value: How much they spend.
RFM has been a cornerstone of direct marketing and retail customer analysis, helping businesses identify their most valuable customers and predict future behavior based on past interactions. This method is data-driven, relying on transaction history rather than subjective factors like demographics or psychographics, and ensures that segmentation is precise and actionable. This allows for targeted marketing efforts that can significantly improve customer engagement and retention.
While all three RFM components are crucial, focusing on Recency and Frequency provide more actionable insights for driving customer retention and growth:
- Recency is often the most critical factor because customers who have purchased recently are more likely to purchase again. This is a key indicator of an engaged customer. Empirical studies have shown that recency can be a strong predictor of future behavior. The rationale is that customers who have purchased recently are top of mind, familiar with your products or services, and more likely to respond to marketing efforts. This correlation is especially strong in businesses where purchasing behavior tends to be habitual or where the product/service has a shorter lifecycle.
- Frequency is typically the second most important factor. Customers who purchase more often are generally more valuable because they demonstrate a pattern of engagement and satisfaction. Frequent purchasers are more likely to have a strong relationship with the brand, which can translate into a higher CLV. This metric can sometimes be on par with recency, especially in subscription models or industries with frequent purchasing cycles.
- Monetary value, while still important, often shows a weaker correlation with Customer Lifetime Value (CLV) compared to recency and frequency. Research supports that customers who make frequent and recent purchases are more likely to continue buying from a brand, whereas high monetary value alone offers no assurance of future behavior. Monetary value can highlight high spenders, but not necessarily potential for future purchases.
Indeed, there is a reason its “RFM” and not “MRF” or “MFR” analysis. The order of the letters related to the relative importance of each component. By understanding which customers are engaging with your brand most recently and frequently, you can tailor your strategies to maximize their lifetime value.
The Recency-Frequency Matrix Framework
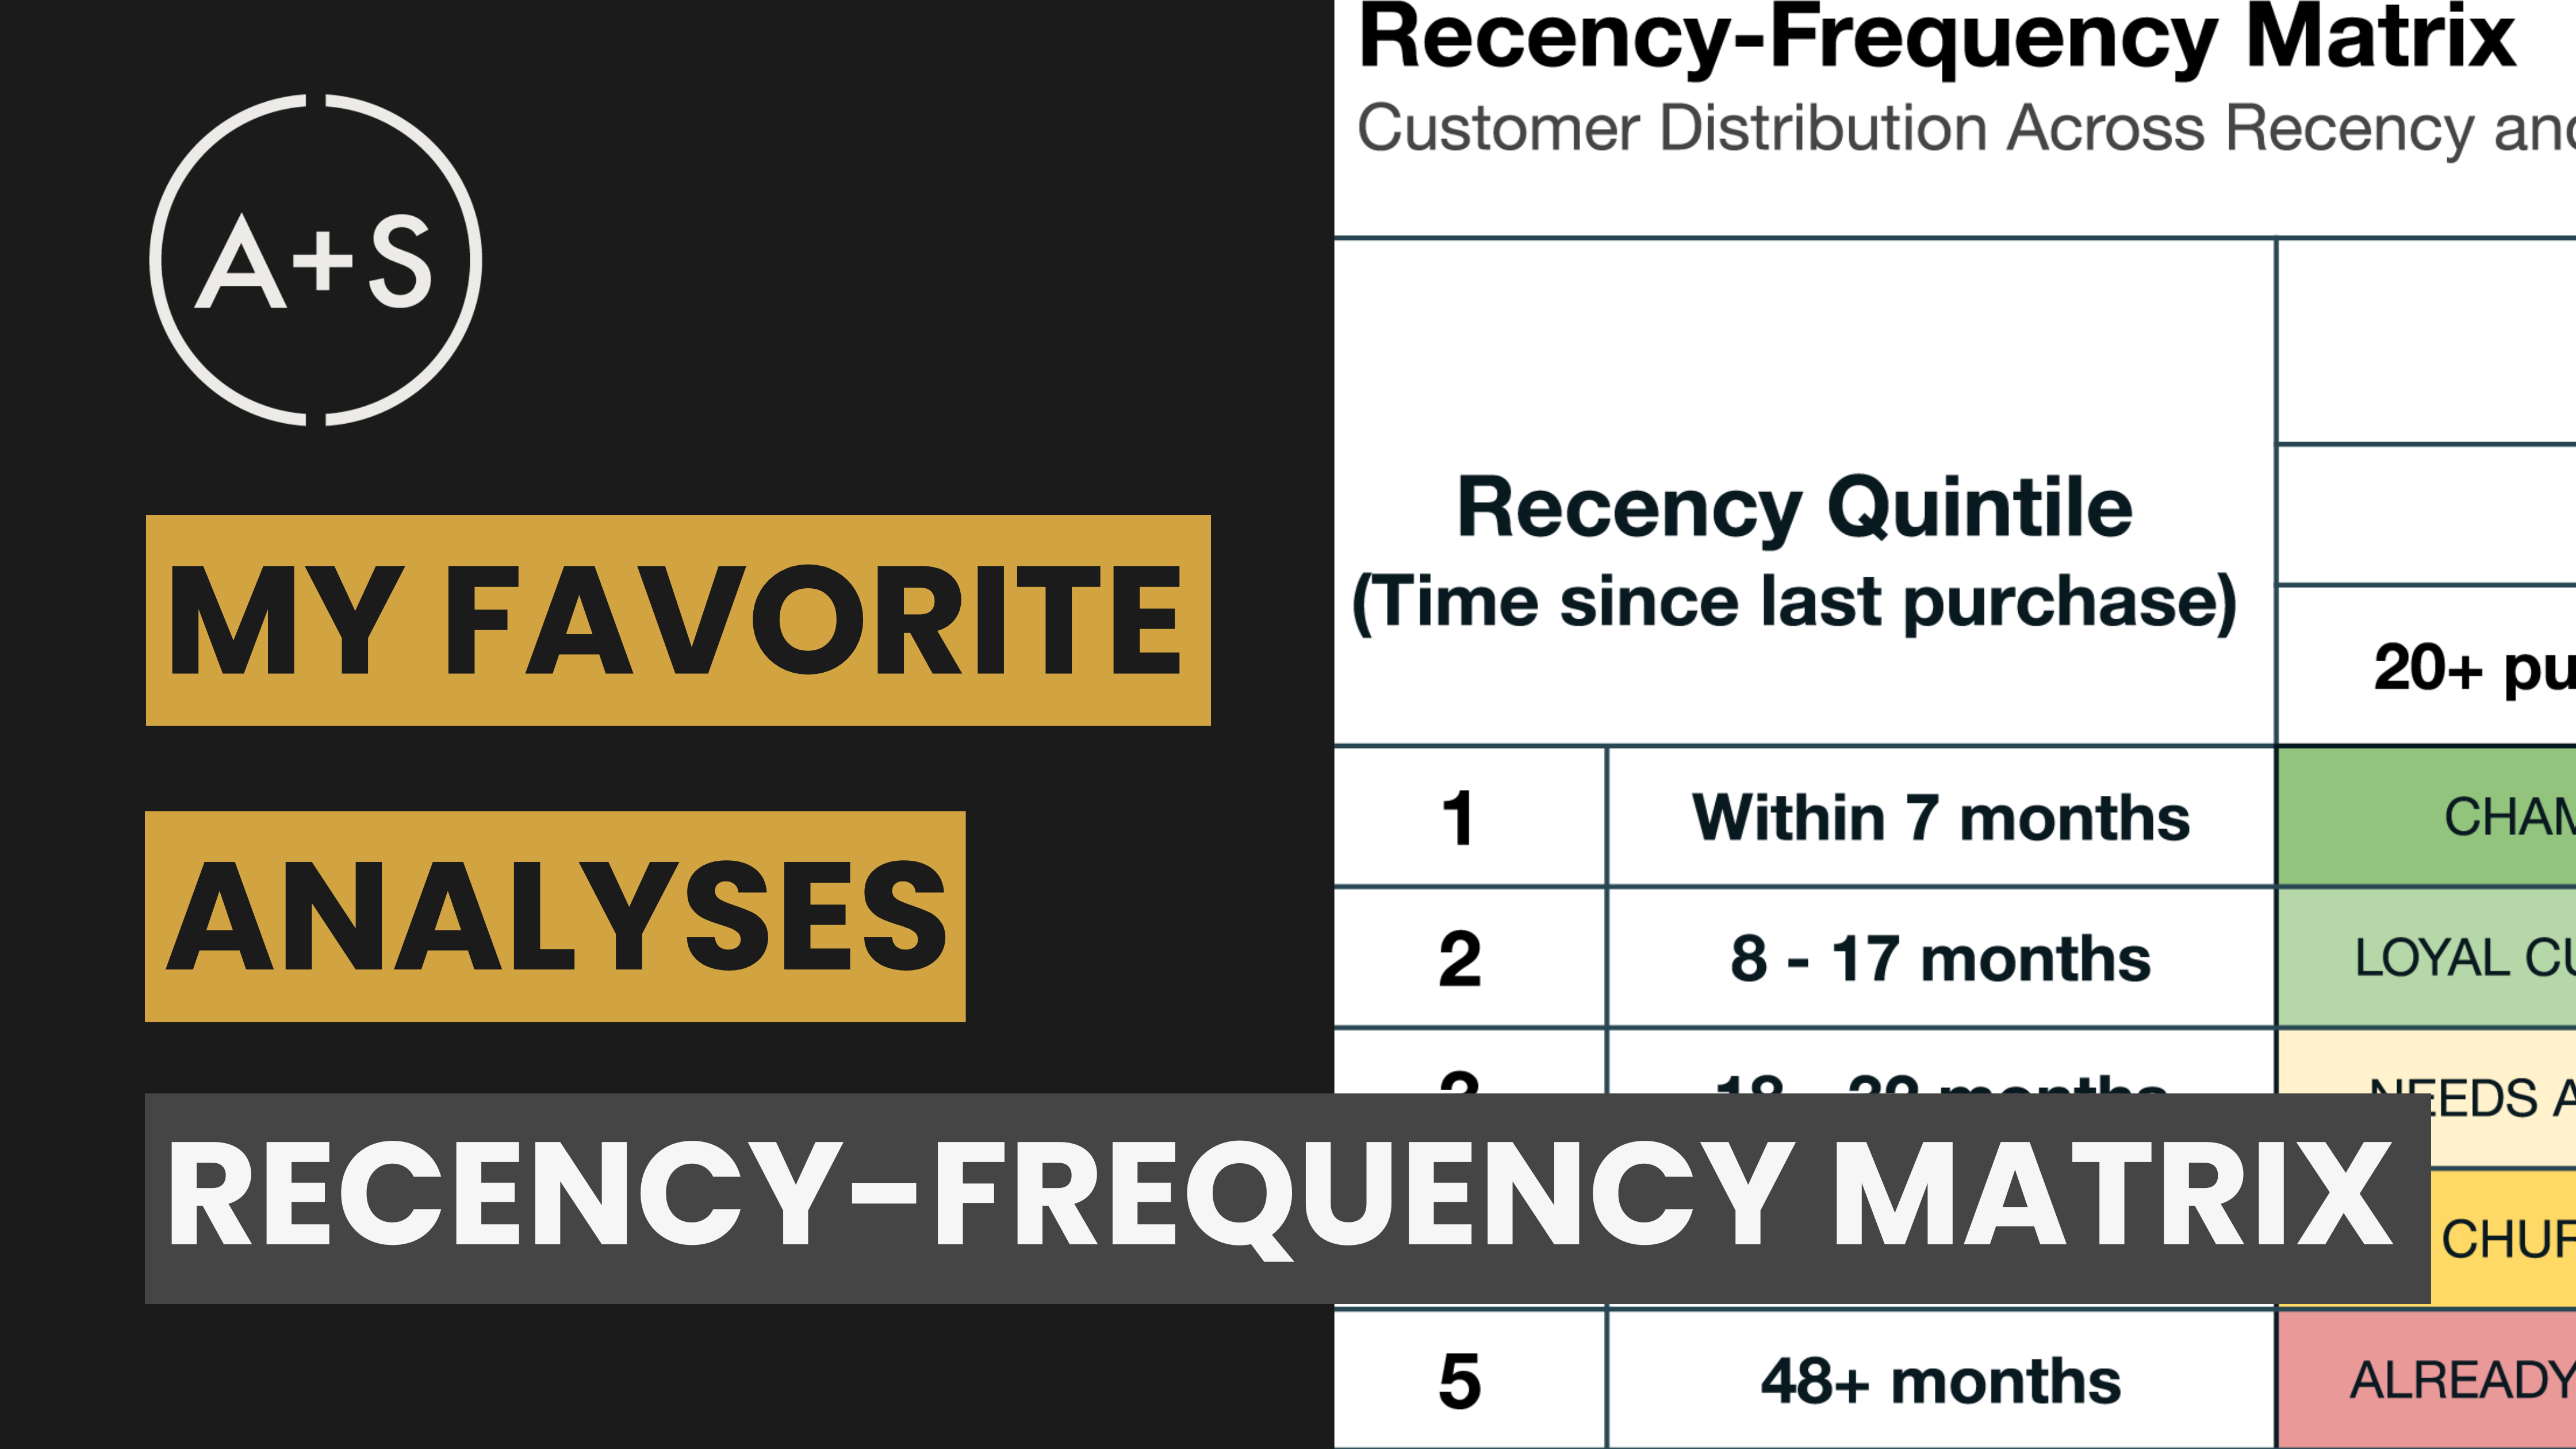
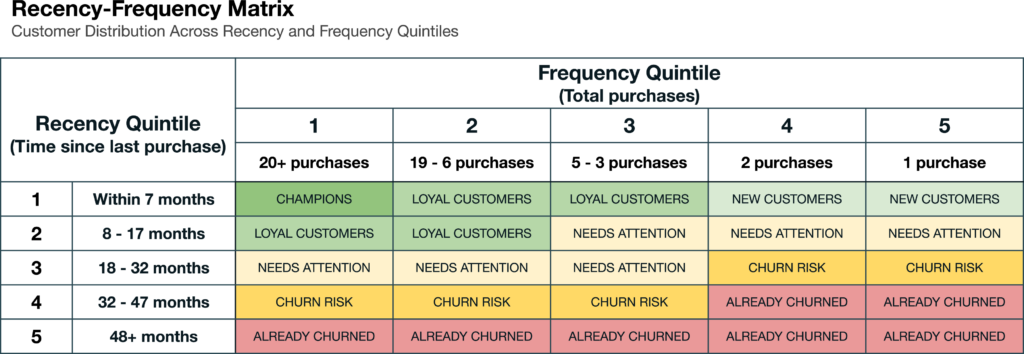
The Recency-Frequency Matrix is a powerful tool that categorizes customers on the two most important dimensions of customer value. This framework offers a clear visual representation of customer segments, allowing businesses to easily identify where each customer stands today and the potential they have for tomorrow. The matrix can be divided into the following segments:
- Champions (High Recency, High Frequency): These customers purchase frequently and recently, making them your most valuable segment. They should be nurtured with exclusive offers, loyalty rewards, and personalized communication to maintain their high engagement levels.
- Loyal Customers (High Recency, Moderate Frequency): These customers buy regularly but not as frequently as your Champions. They are still highly engaged and can be encouraged to increase their purchasing frequency through special incentives.
- Needs Attention (Moderate Recency, Moderate Frequency): Customers in this segment have shown steady engagement but may not have purchased recently. They need attention to prevent them from drifting away, and targeted campaigns can help re-engage them.
- Churn Risk (Moderate Recency, Low Frequency): These customers haven’t purchased recently and do so infrequently. They are at risk of churning, so try to win them back with strong incentives or reminders of past positive experiences.
- Already Churned (Low Recency, Low Frequency): These customers have not purchased for a long time and did so infrequently. It may not be worth spending marketing dollars to re-engage them, so focus on acquisition or nurturing other segments instead.
By categorizing your customers this way, you gain a strategic overview that can guide your decisions on how to communicate with each segment and where to allocate resources most effectively. Most often, I will break segments based on quintiles or quartiles, although deciles are not out of the question. It all comes down to the customer base’s size and diversity:
Strategic Applications: Personalization and Budget Allocation
The Recency-Frequency Matrix offers businesses the ability to create highly personalized marketing campaigns rooted in a clear comprehension of customer value and potential. By understanding the behavior of different customer segments, companies can tailor their messaging, offers, and timing to each group’s specific needs and preferences. This not only increases the relevance of marketing communications but also maximizes the impact of marketing budgets by focusing resources on the most promising customers.
For example, “Champion” customers — those who buy frequently and recently — might receive early access to new products and personalized loyalty rewards. In contrast, customers at risk of churning might be targeted with win-back campaigns featuring strong incentives to re-engage them. Customers who have been identified as already churned should be earn significantly fewer resources and less attention.
The table below outlines specific actions you can take for each segment:
| Customer Segment | Actions | Purpose |
|---|---|---|
| Champions | – Offer early access to new products or services – Implement a loyalty rewards program – Send personalized communications | Maintain high engagement and loyalty, ensuring continued frequent purchases |
| Loyal Customers | – Provide special incentives to boost frequency – Send reminders of product/service benefits – Launch re-engagement campaigns | Encourage more frequent purchases and reinforce their positive experience |
| Needs Attention | – Deploy reactivation campaigns with tailored offers – Request feedback to address potential concerns – Offer exclusive deals | Prevent potential churn by re-engaging them and addressing any issues |
| Churn Risk | – Create win-back campaigns with significant incentives – Remind them of positive past experiences – Provide personalized offers | Reignite interest in the brand, aiming to convert at-risk customers back into active ones |
| Already Churned | – Send occasional check-ins with updates – Use targeted ads for reintroduction – Focus on new customer acquisition | Manage resources effectively by balancing re-engagement efforts with new customer acquisition |
These tactics align your marketing efforts with your customers’ behaviors, maximizing their value to your business and the marketing dollars you invest.
Implementing the Recency-Frequency Matrix in SQL, Excel, and R
There are several approaches to preparing data for the Recency-Frequency analysis from raw customer transaction data. First, you must choose between a spreadsheet (easier to use) or a more complex tool like SQL or R (better for bigger datasets). Once a tool is selected, there are various functions and techniques available to determine each customer’s most recent purchase (Recency) and tally the number of purchases made during the analysis timeframe (Frequency).
Here are the methods I most commonly use to prepare my data using various tools:
In Excel and Google Sheets:
- To calculate Recency, you can identify the most recent purchase date for each customer using the
MAXIFSfunction and partition those dates (i.e., quartiles, quintiles, or deciles depending on the size and natural breaks of your customer base) using thePERCENTRANKfunction. - For Frequency, you can count the total number of orders each customer has placed by using the
COUNTfunction and, like with Recency, assign customers to appropriate partition using thePERCENTRANKfunction.
With your data prepped, you can use the spreadsheet’s pivot table function to create a Recency-Frequency Matrix by placing Recency segment to the rows and Frequency segment to the columns. This will slot each customer into a distinct segment in the matrix.
Excel’s row limit of about 1,048,576 rows, however, may not suffice for large datasets. Google Sheets offers similar functionality but also has its own limitations on data size, making these tools best suited for small to medium-sized datasets. When working with larger data, SQL and R become essential tools.
In SQL, creating the Recency-Frequency Matrix involves using specific commands to calculate key metrics.
- To calculate Recency, you can use the
DATEDIFFfunction to find the difference between the current date and the customer’s last purchase date. This is done by selecting the maximum purchase date for each customer with theMAXfunction. - To calculate Frequency, you use the
COUNTfunction to tally the number of purchases each customer has made.
Once these values are determined, you can group customers into quartiles / quintiles / deciles using the NTILE function.
In R, you can use the RFM package to perform complex segmentation along the lines of Recency and Frequency.
- To calculate Recency, the package will determine the number of days since each customer’s last purchase by identifying the most recent transaction date for each customer and calculating the difference from the analysis date.
- For Frequency, the package counts the total number of purchases each customer has made over a specified period.
Once these scores are calculated, RFM enables you to segment customers into distinct groups based on their recency and frequency value scores. R also provides advanced visualization options, such as heat maps and scatter plots, which help you to better understand customer segments and their distribution across these dimensions. These features make R a powerful tool for performing detailed and scalable customer segmentation analysis.
Conclusion
The integration of the Recency-Frequency Matrix into your customer analysis offers a accurate and actionable understanding of customer behavior. By leveraging tools like SQL, Excel, and R to implement the Recency-Frequency Matrix, businesses can craft data-driven marketing strategies that are both effective and efficient across customer bases of all sizes and complexities.
To learn more about the Recency-Frequency Matrix, look for a video tutorial on our YouTube channel where we take a deeper, visual look at this approach .


