

As analysts, our constant pursuit is to find the narrative hidden in our data. And in this pursuit, regression analysis is one of our most powerful tools. It takes us beyond surface-level observations and into a place of deep, practical understanding; where we can anticipate patterns, pinpoint crucial factors, and utilize data-driven reasoning to drive our strategies forward.
Today will cover the fundamentals of regression and show how it can be applied to gain a deeper understanding of the connections between variables in your business strategies.
What is Regression?
At its core, regression analysis is a statistical method used to examine the relationship between one or more independent variables (predictors) and a dependent variable (the outcome you’re trying to explain or predict, like conversions or sales). The goal of regression is to understand how changes in the independent variables influence the dependent variable and, based on that relationship, make predictions or decisions.
Regression is a valuable tool as it enables you to measure the impact of different factors (such as advertising expenses, customer engagement, or pricing methods) on key outcomes like sales, website traffic, or customer loyalty. This goes beyond just surface-level observations and allows you to identify the underlying patterns that drive your results.
Ordinary Least Squares (OLS) regression is the most commonly used form. The formula looks like this:
Y = β₀ + β₁X₁ + β₂X₂ + … + βₙXₙ + ε
Where:
- Y is the dependent variable (the outcome you’re predicting).
- X₁, X₂, Xₙ are the independent variables (the factors influencing the outcome, such as ad spend, social media engagement, or email open rates).
- β₀ is the intercept, representing the baseline value of Y when all X variables are zero.
- β₁, β₂, βₙ are the coefficients that quantify the effect of each independent variable on the dependent variable.
- ε is the error term, accounting for the variation that the model can’t explain.
Let’s say you’re trying to predict monthly sales (Y) based on your digital marketing spend (X₁) and email engagement rates (X₂). Regression analysis will help you determine how much each of these variables contributes to the total sales figure. The coefficients β₁ and β₂ will tell you how much an increase in digital spend or email engagement is expected to raise sales. OLS regression also has the ability to identify variables that reduce your dependent variable, as well. For example, let’s say you’re a scooter rental shop and you notice that each time it rains you rent fewer scooters than usual. OLS regression can tell you the dampening effect (pun intended) rain has on your sales. You could even get to an understanding very detailed data — like the effect of each inch of rain or each hour of rain — has on your sales.
OLS regression is not the only useful type of regression; there is also logistic regression. This method is beneficial when the outcome, or dependent variable, is binary or categorical (things that have a yes/no result like if a consumer clicks on an ad). Imagine running an email campaign and wanting to predict how likely different types of customers are to make a purchase after interacting with it. Logistic regression will show you the likelihood of conversion based on customer engagement metrics. Logistic regression doesn’t tell you how much you could expect to sell when you run an email campaign, but by focusing on probabilities it shows you the types of customers you’ll want to focus your follow-up efforts on.
The formula for logistic regression calculates the probability of a specific outcome occurring and instead of producing a straight line, it generates an S-shaped curve. I’ll save the formula and deep dive on logistic regression for a later newsletter, but for now you should know it’s another regression method that you can add to your analytics arsenal.
Regression has the power to turn data into practical knowledge. This provides analysts with a deeper understanding of the connections between variables and how they can be leveraged to anticipate future results or inform strategies. Whether your goal is to maximize your marketing budget or forecast customer behavior, regression provides a dependable framework for examining past performance and making evidence-based predictions.
Correlation vs Causation
There is an important idea that must always accompany a discussion on regression: the difference between correlation and causation. It’s essential to understand that regression shows there is a relationship between variables. And while two variables may move together, it does not necessarily mean one causes the other. In other words, correlation identifies when variables shift together — either positively or negatively — but it does not confirm that one variable influences or causes the changes in the other.
We see instances all the time when correlation doesn’t remotely mean causation — a direct cause-and-effect relationship between variables. If I hit my thumb with a hammer, it hurts. That is cause-and-effect. But consider that ice cream sales and shark attacks both go up in the summer months. Are sharks biting more humans because they’re full of sweet ice cream? Of course not. In the summer, the earth is warmer in our hemisphere so people buy more ice cream and more of us go in the ocean for a swim. With more people in the water, we’re more likely to bump into a shark. Ice cream consumption and shark bites both increase at the same time, so they have a relationship to one another, but that relationship is not causal.
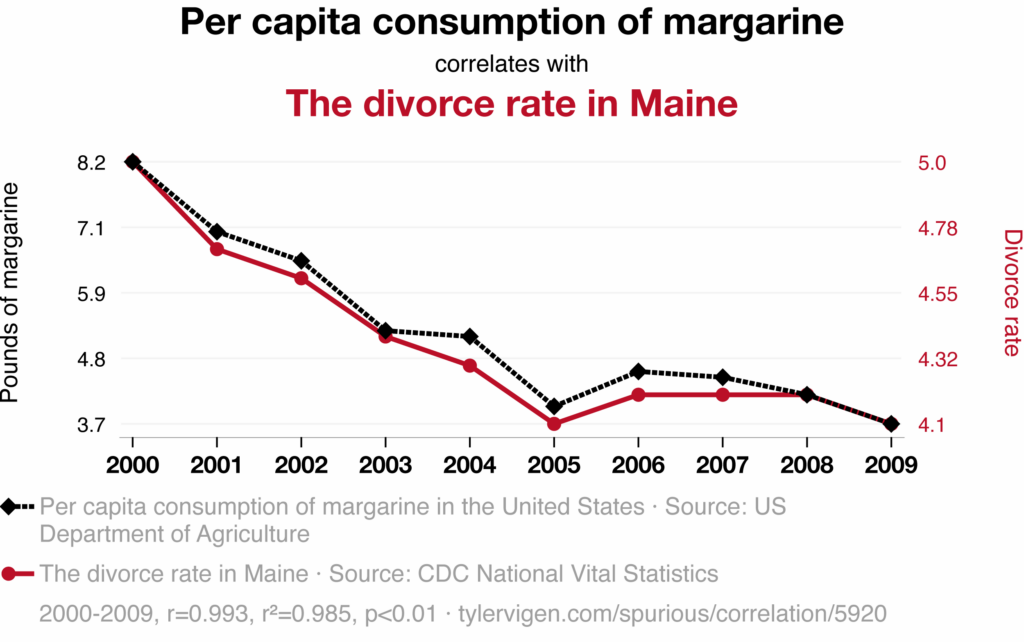
Tyler Vigen’s delightful website, Spurious Correlations, points out other humorous instances of misleading correlations:
We should view correlation as a starting point in research and not as proof of a direct cause-and-effect relationship between variables. Indeed, to prove that cause-and-effect relationship (which we call “causation”) more rigorous testing is necessary to remove potential confounding variables and random chance from the equation.
Causation is usually demonstrated through experiments that isolate variables to determine their true impact. For example, when conducting experiments in marketing, such as measuring the effect of ad campaigns on sales, we aim to establish whether the changes in sales were actually caused by the ad exposure and not just correlated due to other factors like seasonality or external market conditions. Such studies have very high design requirements, take a good amount of time, and cost a lot of money.
The good news is that very rarely is it necessary to get to full casual certainty. There is a very high need to establish causality before a new pharmaceutical drug is approved for release to the general public. But when we’re talking to what extent a digital ad campaign had on sales, the requirement for causality should be balanced against the resources needed to achieve certainty. Simply put, a smart executive shouldn’t need causality to validate their gut instincts — a positive result from a well-executed OLS regression analysis should be more than enough to do the trick.
When to Use Regression: Some Common Use Cases
Whether you’re seeking to comprehend what influences customer behavior or justify an increase in your marketing budget, regression analysis can provide essential guidance. To determine if and when you should use regression, consider the following times when it works very well:
- To Measure the Impact of Multiple Variables on a Single Outcome
Regression analysis is useful in understanding the impact of multiple independent variables on a single dependent variable, such as sales or website traffic. In marketing, it can help measure the effectiveness of different channels in a multi-channel campaign and allocate budget accordingly for maximum conversions.
- To Predict Future Outcomes Based on Historical Data
Regression is a valuable tool for predicting future behavior based on past data. It helps marketers forecast outcomes like sales, customer lifetime value, and potential impact of price changes. By analyzing historical data and identifying patterns, regression allows for informed predictions about performance. For example, if investing in Facebook Ads has historically impacted sales, regression can estimate revenue from increasing ad spend in the next quarter. This predictive modeling is crucial for data-driven decision making, especially for resource allocation and future planning.
- To Optimize Marketing Strategies and Test Hypotheses
Regression analysis can validate assumptions and test hypotheses. It is particularly helpful for changing independent variables, such as testing new ad creatives or adjusting targeting criteria, by showing the impact on key dependent variables like Return On Ad Spend (ROAS) and Customer Acquisition Costs (CAC).
- To Understand the Relationship Between Categorical Variables
Logistic regression is perfectly suited for binary or categorical outcomes. It can predict customer actions like purchases, unsubscribes, and ad clicks. For example, you can use it to model the probability of conversion based on touchpoints such as website visits, emails, and social media engagement. This helps identify effective touchpoints and adjust marketing strategies accordingly.
- To Control for External Factors
External factors can affect consumer behavior, making it difficult to accurately analyze data. Regression helps control for these factors and isolate the true impact of your marketing activities. For example, if sales drop in a certain month, regression can determine if it’s due to marketing efforts or other influences like new competitors or economic downturns. This allows for more accurate conclusions about the effectiveness of marketing strategies.
- To Gain Actionable Insights from Your Data
Regression analysis turns data into actionable insights, helping you understand the underlying reasons behind trends. It helps identify key drivers of performance and areas for improvement. This can help you optimize marketing strategies and make more informed decisions. Whether forecasting, testing, or measuring, regression equips analysts with deeper insights and the ability to adjust and optimize outcomes.
Key Insights for Analysts Using Regression
In regression analysis, there are several important factors to consider in order to understand the strength and reliability of your analysis. These measures provide valuable insights into the effectiveness of your model in fitting the data and making accurate predictions.
- Identify Key Independent Variables: One major advantage of regression analysis is its ability to identify which variables have the most significant influence on your outcome and which do not. By testing and then prioritizing the variables that truly impact performance (such as advertising spending or customer engagement), you can make more strategic marketing decisions. However, it is crucial to also evaluate how well your model explains the variations in your data.
- Understanding Key Measures of Regression — R and R²: The letter R represents the correlation coefficient in regression analysis, which measures the strength and direction of the linear relationship between the dependent and independent variables. It has a range of -1 to 1, with 1 indicating a perfect positive correlation, -1 a perfect negative correlation, and 0 representing no linear relationship. For analysts, a high R value indicates a strong connection between independent variables (such as advertising spending) and dependent variables (such as sales). Meanwhile, R-squared is an important metric for evaluating how well your regression model explains the variations in your data. It represents the percentage of variance in the dependent variable (sales) that can be accounted for by the independent variables (ad spend, customer service). A higher R² value suggests you’ve build a better regression model and you’ll have more accurate predictions.
- Use Visualization: Visualizing the results of your regression analysis can help you better interpret relationships between variables. Scatter plots with overlaying regression lines can show how well the model fits the data, making complex insights easier to understand and communicate to stakeholders who may not be as familiar with regression techniques.
- Understand Regression’s Limitations: While regression analysis can provide valuable insights into your data, it is not without limitations. A high R² does not necessarily mean a causal relationship exists; it only shows correlation. Note, too, that the accuracy of your model heavily depends on the quality of your data. It is crucial to ensure that your data is clean, complete, and relevant in order to obtain meaningful results from regression analysis.
By understanding these key insights, regression analysis can help inform data-driven decisions. Adding it to your analyst toolkit will lead to improved business performance and better measurable results.
Conclusion: Making Regression Part of Your Toolkit
Whether you’re analyzing customer behavior or optimizing ad campaigns, regression analysis turns raw data into strategic insight. It helps you understand the “why” behind your results, enabling you to make more informed decisions. If you haven’t yet integrated regression into your marketing analysis, now is the time.
Give it a go with your current campaigns and begin to unearth the untold tales that your data is waiting to reveal.


