


Last week, we established the mathematical framework for our 2×2 behavioral data matrix. We demonstrated how a median split creates an objective, mathematically balanced center that partitions a customer dataset into four clean zones, eliminating corporate bias and reducing cognitive overload.
But a visual matrix is only a hollow shell without a deep diagnostic understanding of the specific behaviors inside it. If you do not explicitly profile the distinct behavioral archetypes within each quadrant, you cannot evaluate marketing efforts or identify exactly where your sales capacity is being quietly wasted.
To maximize organizational performance, we must define the four behavioral archetypes across our matrix to separate frictionless, high-value revenue opportunities from resource-intensive black holes.
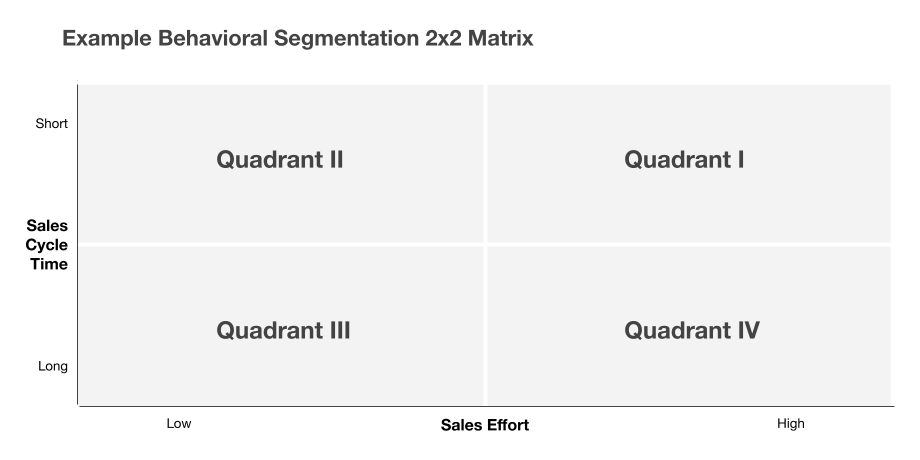
To make this concept real, let us look at a baseline example where the vertical behavioral axis represents sales velocity (how quickly a customer sale is made, sometimes referred to as “Sales Cycle Time”), and the horizontal axis measures touchpoint volume (how many marketing and sales interventions the customer experiences, sometimes referred to as “Sales Effort”).
For this example, we’ll assume that the vertical axis ranges at the bottom from “Long” (customers who took a long time to close) up to “Short” (customers whose sales closed quickly). We’re flipping the axis here to place the more desirable data (quick sales) at the top. The horizontal axis will be designed the traditional way, ranging from “Low” (fewer touchpoints) on the left to “High” (more touchpoints) on the right.
The High-Velocity Revenue Engines
When you look above the vertical median of your dataset, you isolate the customers that move with speed.
- Quadrant II (Top-Left) – The “Express Lane”: These are your optimal accounts, representing frictionless, fast wins that yield clean, highly efficient revenue with minimal operational strain. Because these deals require a low volume of marketing touchpoints, they flow naturally through your pipeline to create maximum financial impact.
- Quadrant I (Top-Right) – The “Heavy Lift”: These accounts close rapidly, but they require a high volume of marketing interactions and immense internal effort to cross the finish line. Because their deal velocity remains high, the sudden surge of corporate resource allocation is entirely worth the investment. They are heavy consumers of corporate capacity, but their rapid conversion rate keeps pipeline momentum moving forward.
The Low-Velocity Efficiency Drains
When you look below the mathematical median of the Sales Cycle Time axis, you find the true drag on your sales engine.
- Quadrant IV (Bottom-Right) – The “Triage Ward”: These accounts are the ultimate pipeline black holes, consuming endless corporate capacity and requiring constant touchpoints from your teams. Because they move at an agonizingly slow pace, they severely drain organizational efficiency, forcing high internal effort to yield low velocity.
- Quadrant III (Bottom-Left) – The “Ghost Trails”: These are stagnant, low-activity accounts that move slowly and show very few signs of active engagement. They consume very few active resources, but they sit quietly in the pipeline, creating background noise that distorts your forecasting data without contributing true strategic value to the organization.
Mapping Other Behaviors on the 2X2
Identifying the four behavioral archetypes in our example allows you to see exactly where value is concentrated and where capacity is being drained. But you have the license to use whatever behavioral metrics you like.
Swapping “Sales Cycle Time” with “Average Profit Margin” can help you hone your marketing to optimize profitability. By placing customer acquisition cost on one axis and a digital engagement score on the other, a stakeholder can easily see where your budget is driving true behavioral intent. The digital engagement score can be constructed by aggregating micro-conversions on your webpage, such as product views, cart additions, and newsletter sign-ups.
Mapping these variables across the four quadrants reveals which marketing channels are successfully converting high-intent prospects at a low cost versus which channels represent expensive, low-yielding efficiency drains. This flexible architecture ensures that your data matrix functions as a dynamic decision-making engine rather than a static descriptive report. By tailoring the variables to your specific operational needs, you can identify hidden opportunities and optimize resource allocation with clinical precision.
Theory to Practice
To apply this behavioral framework to your pipeline this week, complete these four tactical steps:
- Audit your active matrix variables: Review the axes of your current 2×2 data matrix to determine if they are still aligned with your immediate business goals.
- Pair financial outcomes with behavioral effort: Swap out generic volume metrics with average profit margin or customer lifetime value to evaluate the true financial return of your customer segments.
- Quantify your digital touchpoints: Group individual digital actions like webpage views and form submissions into a single, composite digital engagement score to measure active customer intent.
- Track segment migration over time: Set a routine timeframe, such as a monthly or quarterly cadence, to update your dataset and monitor how customer accounts migrate between quadrants as their behaviors evolve.
Next week, in the final installment of this series, we will operationalize this matrix. We will provide a concrete playbook for execution, explaining how to pull extreme outliers from the far corners of the matrix to give leadership clear behaviors to react to—allowing you to stop wasting capacity on dead weight and protect your high-velocity revenue streams.


