

Last week, in Part 1 of this segmentation series, we established that traditional market segmentation relies too heavily on static demographic and firmographic data. This reliance creates rigid strategies that leave businesses out of touch with true (and constantly shifting) consumer preferences. We concluded by advocating for a flexible 2×2 matrix built on active behavioral metrics.
But top-tier strategic analysts recognize that a move to behavioral segmentation is not a foolproof solution. They understand that a segmentation tool is only as reliable as the math used to construct it. To deliver real strategic value, you must implement a rigorous mathematical framework that organizes raw data into a clean, balanced behavioral matrix.
Standardizing Metrics Across Disparate Scales
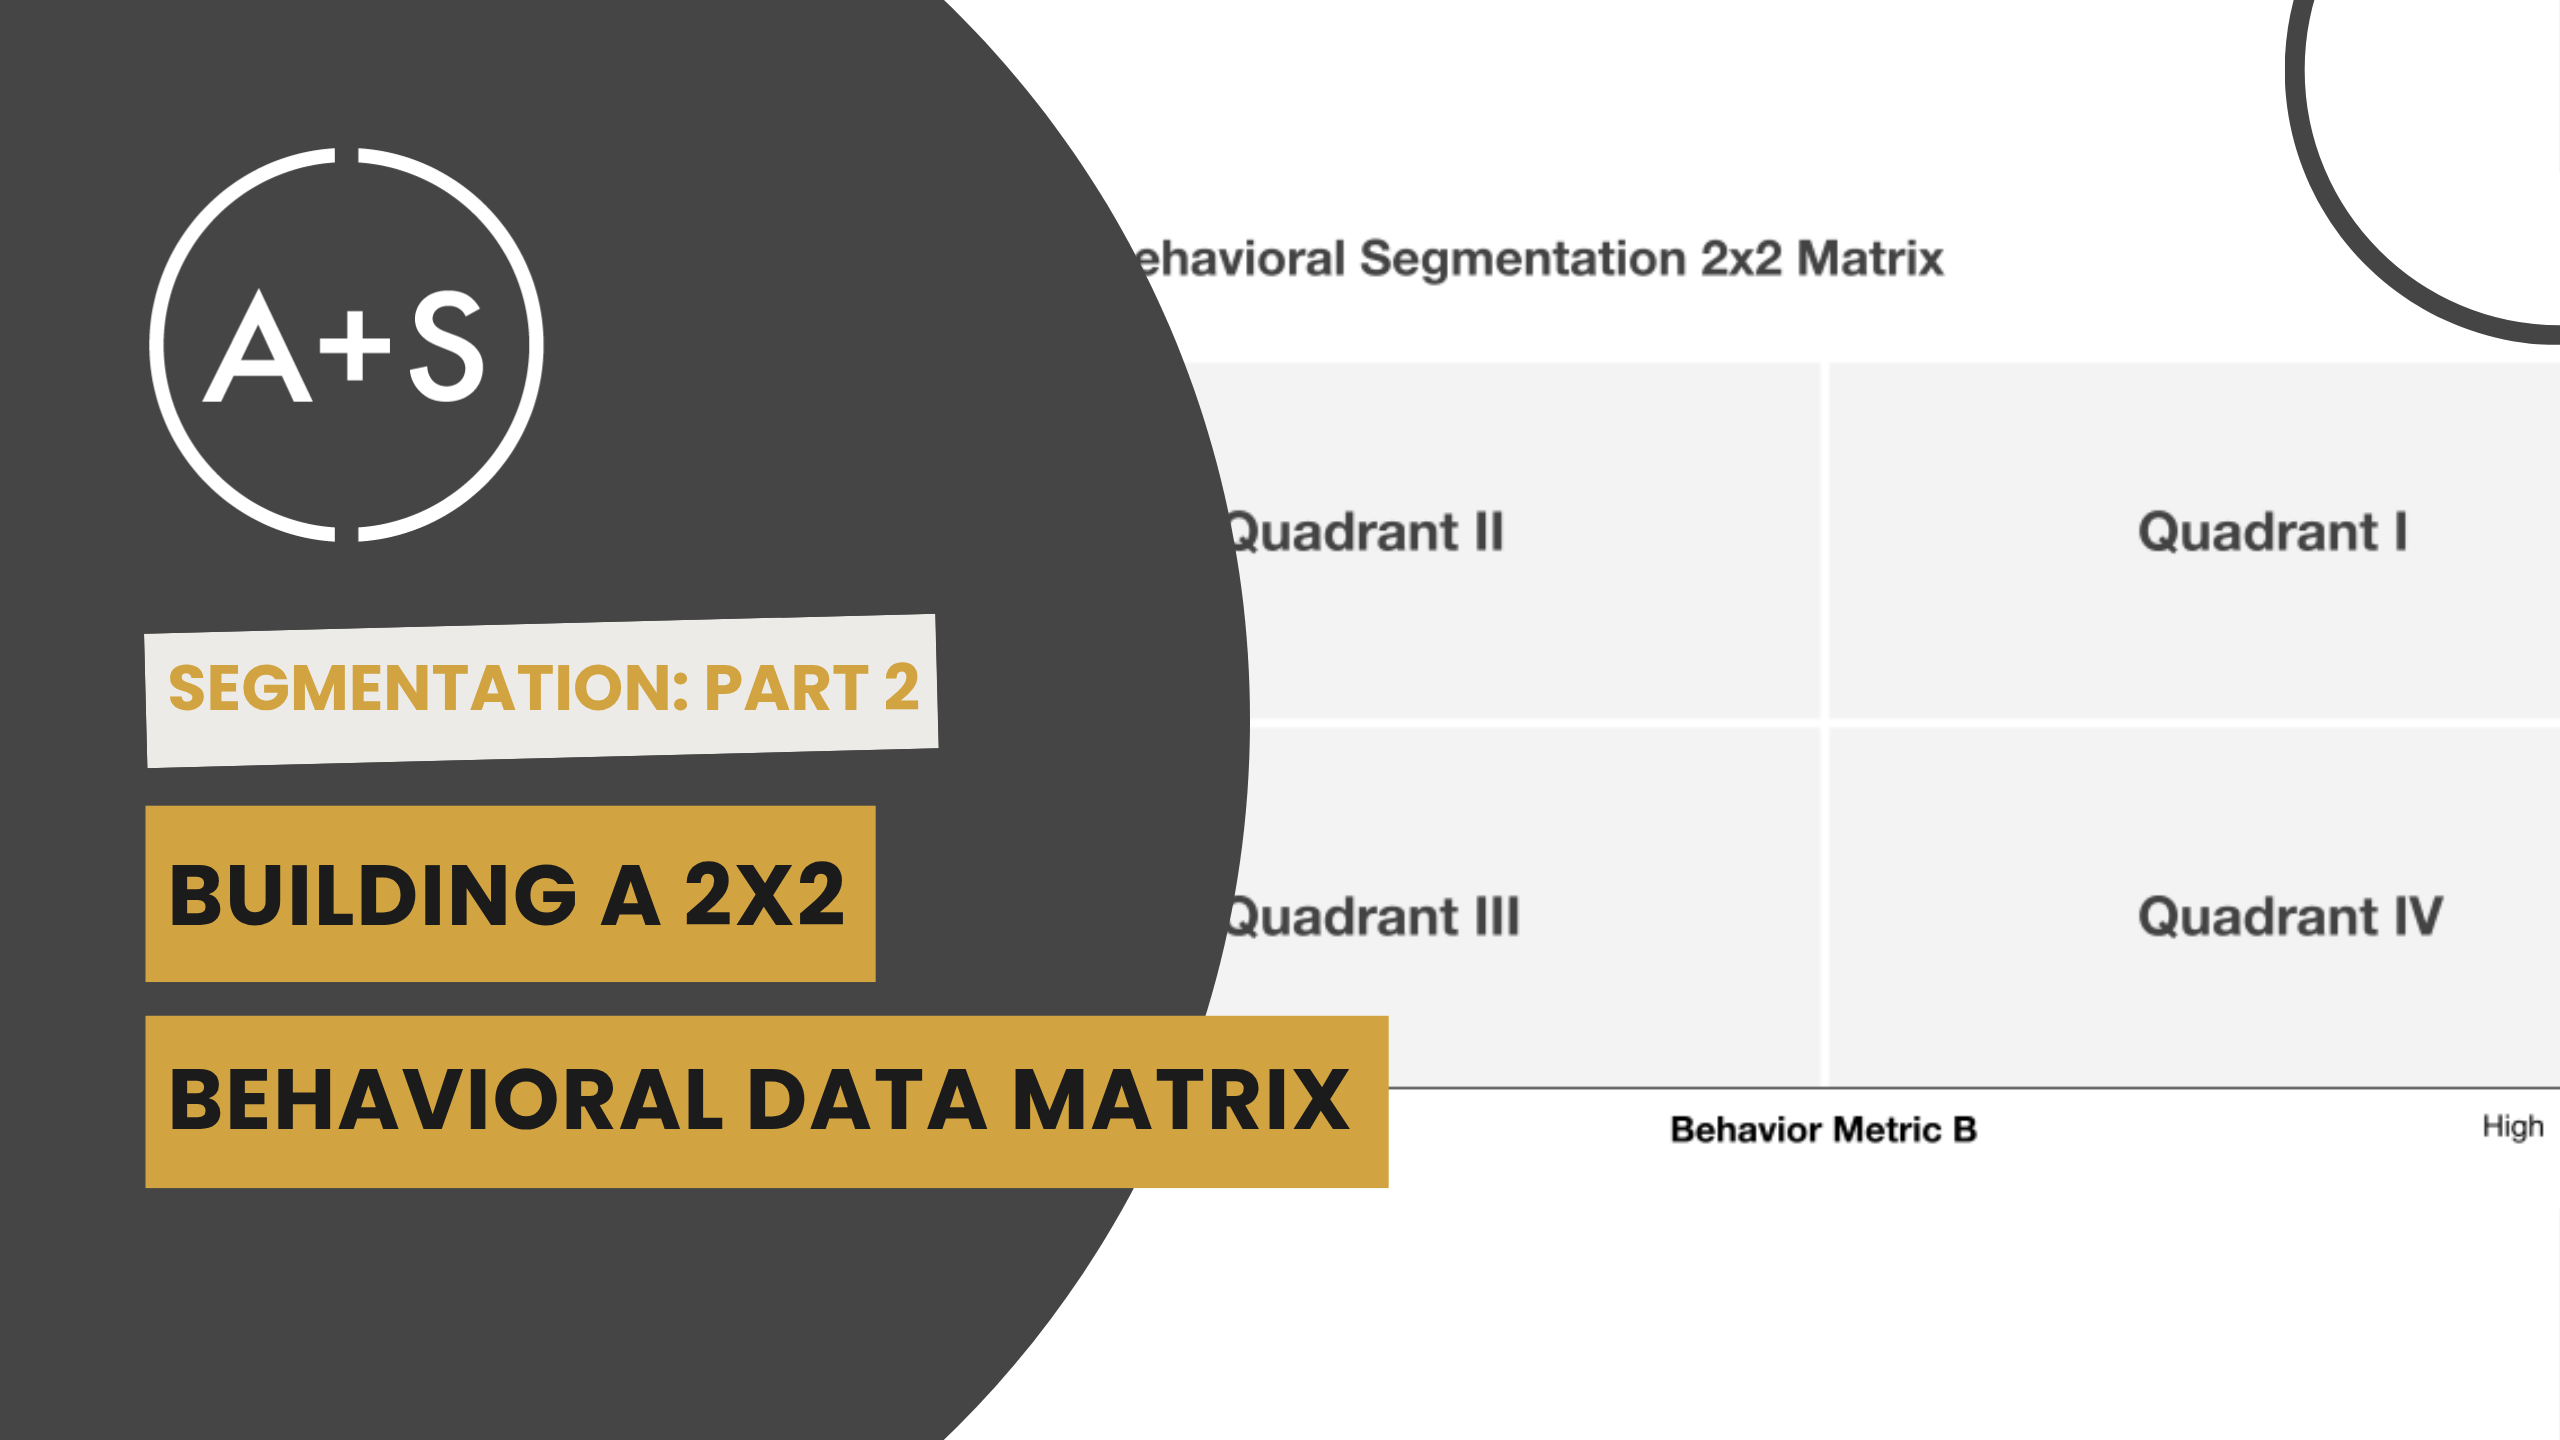
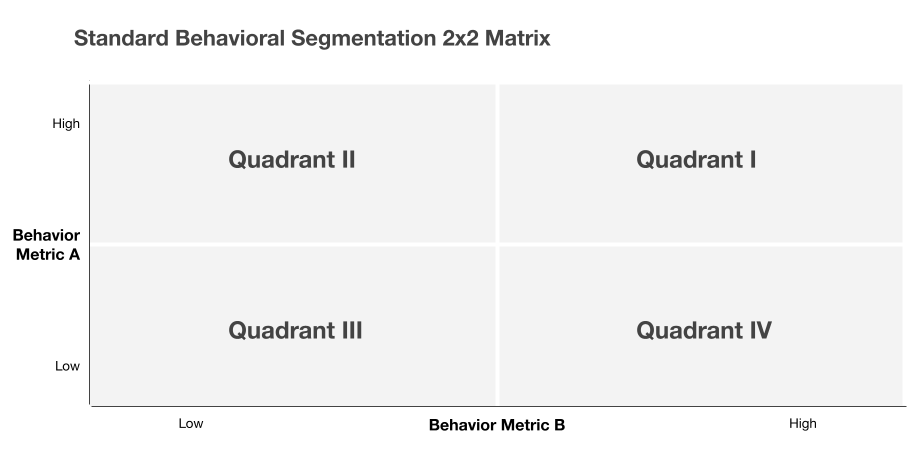
The 2×2 matrix is unmatched in strategic value because it condenses massive datasets into clean visual categories that drive immediate action. Squeezing data into four clear quadrants filters out the noise so executives can focus on the signal and the action.
However, distributing behavioral data across the 2×2 matrix axes presents a unique challenge. When mapping consumer actions, analysts often capture customer interactions across a multi-touch journey. This requires pairing load-bearing behavioral metrics measured on completely different scales over a specific timeframe. For example, an analyst must map the time required to close a sale (“Pipeline Velocity”), typically measured in days, with the number of marketing touchpoints (”Touchpoint Volume”), measured in interaction counts, onto a single framework.
Because these variables use entirely different units, plotting them directly onto a matrix creates a distorted picture. To make the 2×2 matrix a functional tool, you must normalize these disparate metrics to their relative values. A simple “Low to High” range for each axis works best.
Frankly, the absolute value of a behavioral metric rarely matters. What is important is how a consumer’s behavior registers relative to the rest of your customer base. Because of this, the scales of the axes do not need to be identical. The pipeline velocity scale could range from 1 to 31 (assuming it takes up to a month to close a lead), while the touchpoint axis may climb into the hundreds. Standardizing these variables using a simple relative scale ensures that a stakeholder can view the matrix on a summary report or a tracking dashboard without confusion.
Establishing the Axis Center and Balanced Quadrants
Once the behavioral metrics are standardized, you must locate the absolute center of your framework. Calculating the median or the mean of the data creates the objective center of the matrix.
I strongly advocate for the use of the median as your mathematical center. While a mean can be heavily skewed by a few extreme outliers and distort your baseline, the median split roots your thresholds in the actual performance distribution.
This approach partitions your dataset into four perfectly balanced zones. It ensures that 50% of the accounts fall cleanly into the designated quadrants, establishing clean visual fences that eliminate internal corporate bias. Much like a well-organized data visualization, this balanced layout structures information clearly. It completely prevents cognitive overload, allowing leadership to instantly identify high-value segments and differentiate them from resource-intensive accounts.
Theory to Practice
To mathematically build a 2×2 matrix and apply this behavioral framework to your practice this week, execute these four tactical steps:
- Select your active behavioral variables: Identify two load-bearing metrics, such as pipeline velocity and interaction volume, that capture customer engagement or operational friction for your specific business need.
- Standardize the data scales: Normalize your disparate metrics onto a uniform visual scale so that variables with entirely different units can be evaluated together (i.e., “Low to High”).
- Calculate the mathematical midpoints: Compute the exact median of the dataset for both variables to establish the absolute, objective center of your matrix.
- Partition the data into four quadrants: Draw one horizontal line and one vertical line through the calculated midpoints to establish clean visual fences that eliminate internal bias.
Next week, in Part 3 of this discussion, we will explore how to automate strategic action plans across the quadrants, transforming your mathematical matrix into a decision-making engine.
Until next week, Keep Analyzing!
Kevin


